Outcomes Data
Biology Major & Composite Teaching Major
Objective 1a.
Graduates will be able to practice the process of science.
Since Spring 2020, we download outcomes data from Canvas at the end of each academic year. We filter the data to analyze data for biology majors only (raw data with A#s excluded). We look at mastery (2/3 score) in each course as well as improvement across the curriculum. To look at patterns not due to attrition, we track individual student progress (using student A#s) from early to late undergraduate career.
Key to the objectives, subobjectives ,and the courses in the following graphs:
1a.1: Introduction - Context
1a.2: Introduction - Accuracy and relevance
1a.3: Methods
1a.4: Results
1a.5: Discussion - Conclusion
1a.6: Discussion - Limitations
1a.7: Discussion - Implications
1a.8: References
Early scores: Required introductory lab sequence for biology majors (BIOL 1615 & 1625)
Late scores: Required intermediate courses (BIOL 3020, 3055, 3060, 3065, 3070, 3085) and upper-division electives (BIOL 4060, 4750) in which BIOL 1625 is a prerequisite
Points: Points are average scores across assessments and courses for individual biology majors. The more students with the same score, the darker the point.
Red dashes: Mastery score
Black diagonal lines: Points above the diagonal line show progress over time

Trends based on these results from Spring 2020-Spring 2025: Most students are improving from early to late courses, as most points are above the diagonal line. This includes a greater proportion of students mastering objectives in late than early courses, as more late scores are above 2. Importantly, most students are mastering these learning objectives by the time they take intermediate to upper-level courses, as most scores are at or above 2 in the late courses. We do not have evidence that early and late scores are correlated for each of these objectives; perhaps the lack of evidence for correlations suggests we are helping all students improve, regardless of pre- or early college experience, or we could get this pattern from variability in grading across courses.
Objective 1b.
Graduates will be able to use quantitative reasoning, modeling and simulation to solve problems in biology.Since Spring 2020, we download outcomes data from Canvas at the end of each academic year. We filter the data to analyze data for biology majors only (raw data with A#s excluded: https://usu.box.com/s/m97z1ozncxs1krb2ciqwe5kjxbubouxg). We look at mastery (2/3 score) in each course as well as improvement across the curriculum. To look at patterns not due to attrition, we track individual student progress (using student A#s) from early to late undergraduate career. We only show results for subobjectives with available early and late scores. For some of the subobjectives, we only have early or late scores but should have the combination of both in the future.
Key to the objectives, subobjectives, and the courses in the following graphs:
1b.1 Create and interpret graphs
1b.2 Use mathematical equations
1b.3 Statistical analyses
Early scores: Required introductory lecture and lab sequence for biology majors (BIOL 1610, 1620, 1615, 1625)
Late scores: Required intermediate courses (BIOL 3020, 3070, 3085) in which BIOL 1620 and 1625 are prerequisites
Points: Points are average scores across assessments and courses for individual biology majors. The more students with the same score, the darker the point.
Red dashes: Mastery score
Black diagonal lines: Points above the diagonal line show progress over time 
Objective 2
Graduates will be able to recognize and articulate fundamental concepts and principles of biology.
The Biology Department began using the Gen-Bio MAPS assessment program in Spring 2018. The Department experimented with several ways to conduct the assessment in the first year and has settled on a standard methodology: 1) students in BIOL 1610 take the assessment through Canvas at the beginning of the course, 2) students in BIOL 1620 take the assessment through Canvas at the end of the course, and 3) students will take the assessment a third time through Canvas as a Department graduation requirement in their last semester as an undergraduate at Utah State. By focusing on these three time points, our data collection matches the national Gen-Bio MAPS dataset, and we are able to fully use the analytics in the Gen-Bio MAPS program. Students must spend a minimum amount of time on the assessment for the results to be included in our analyses.
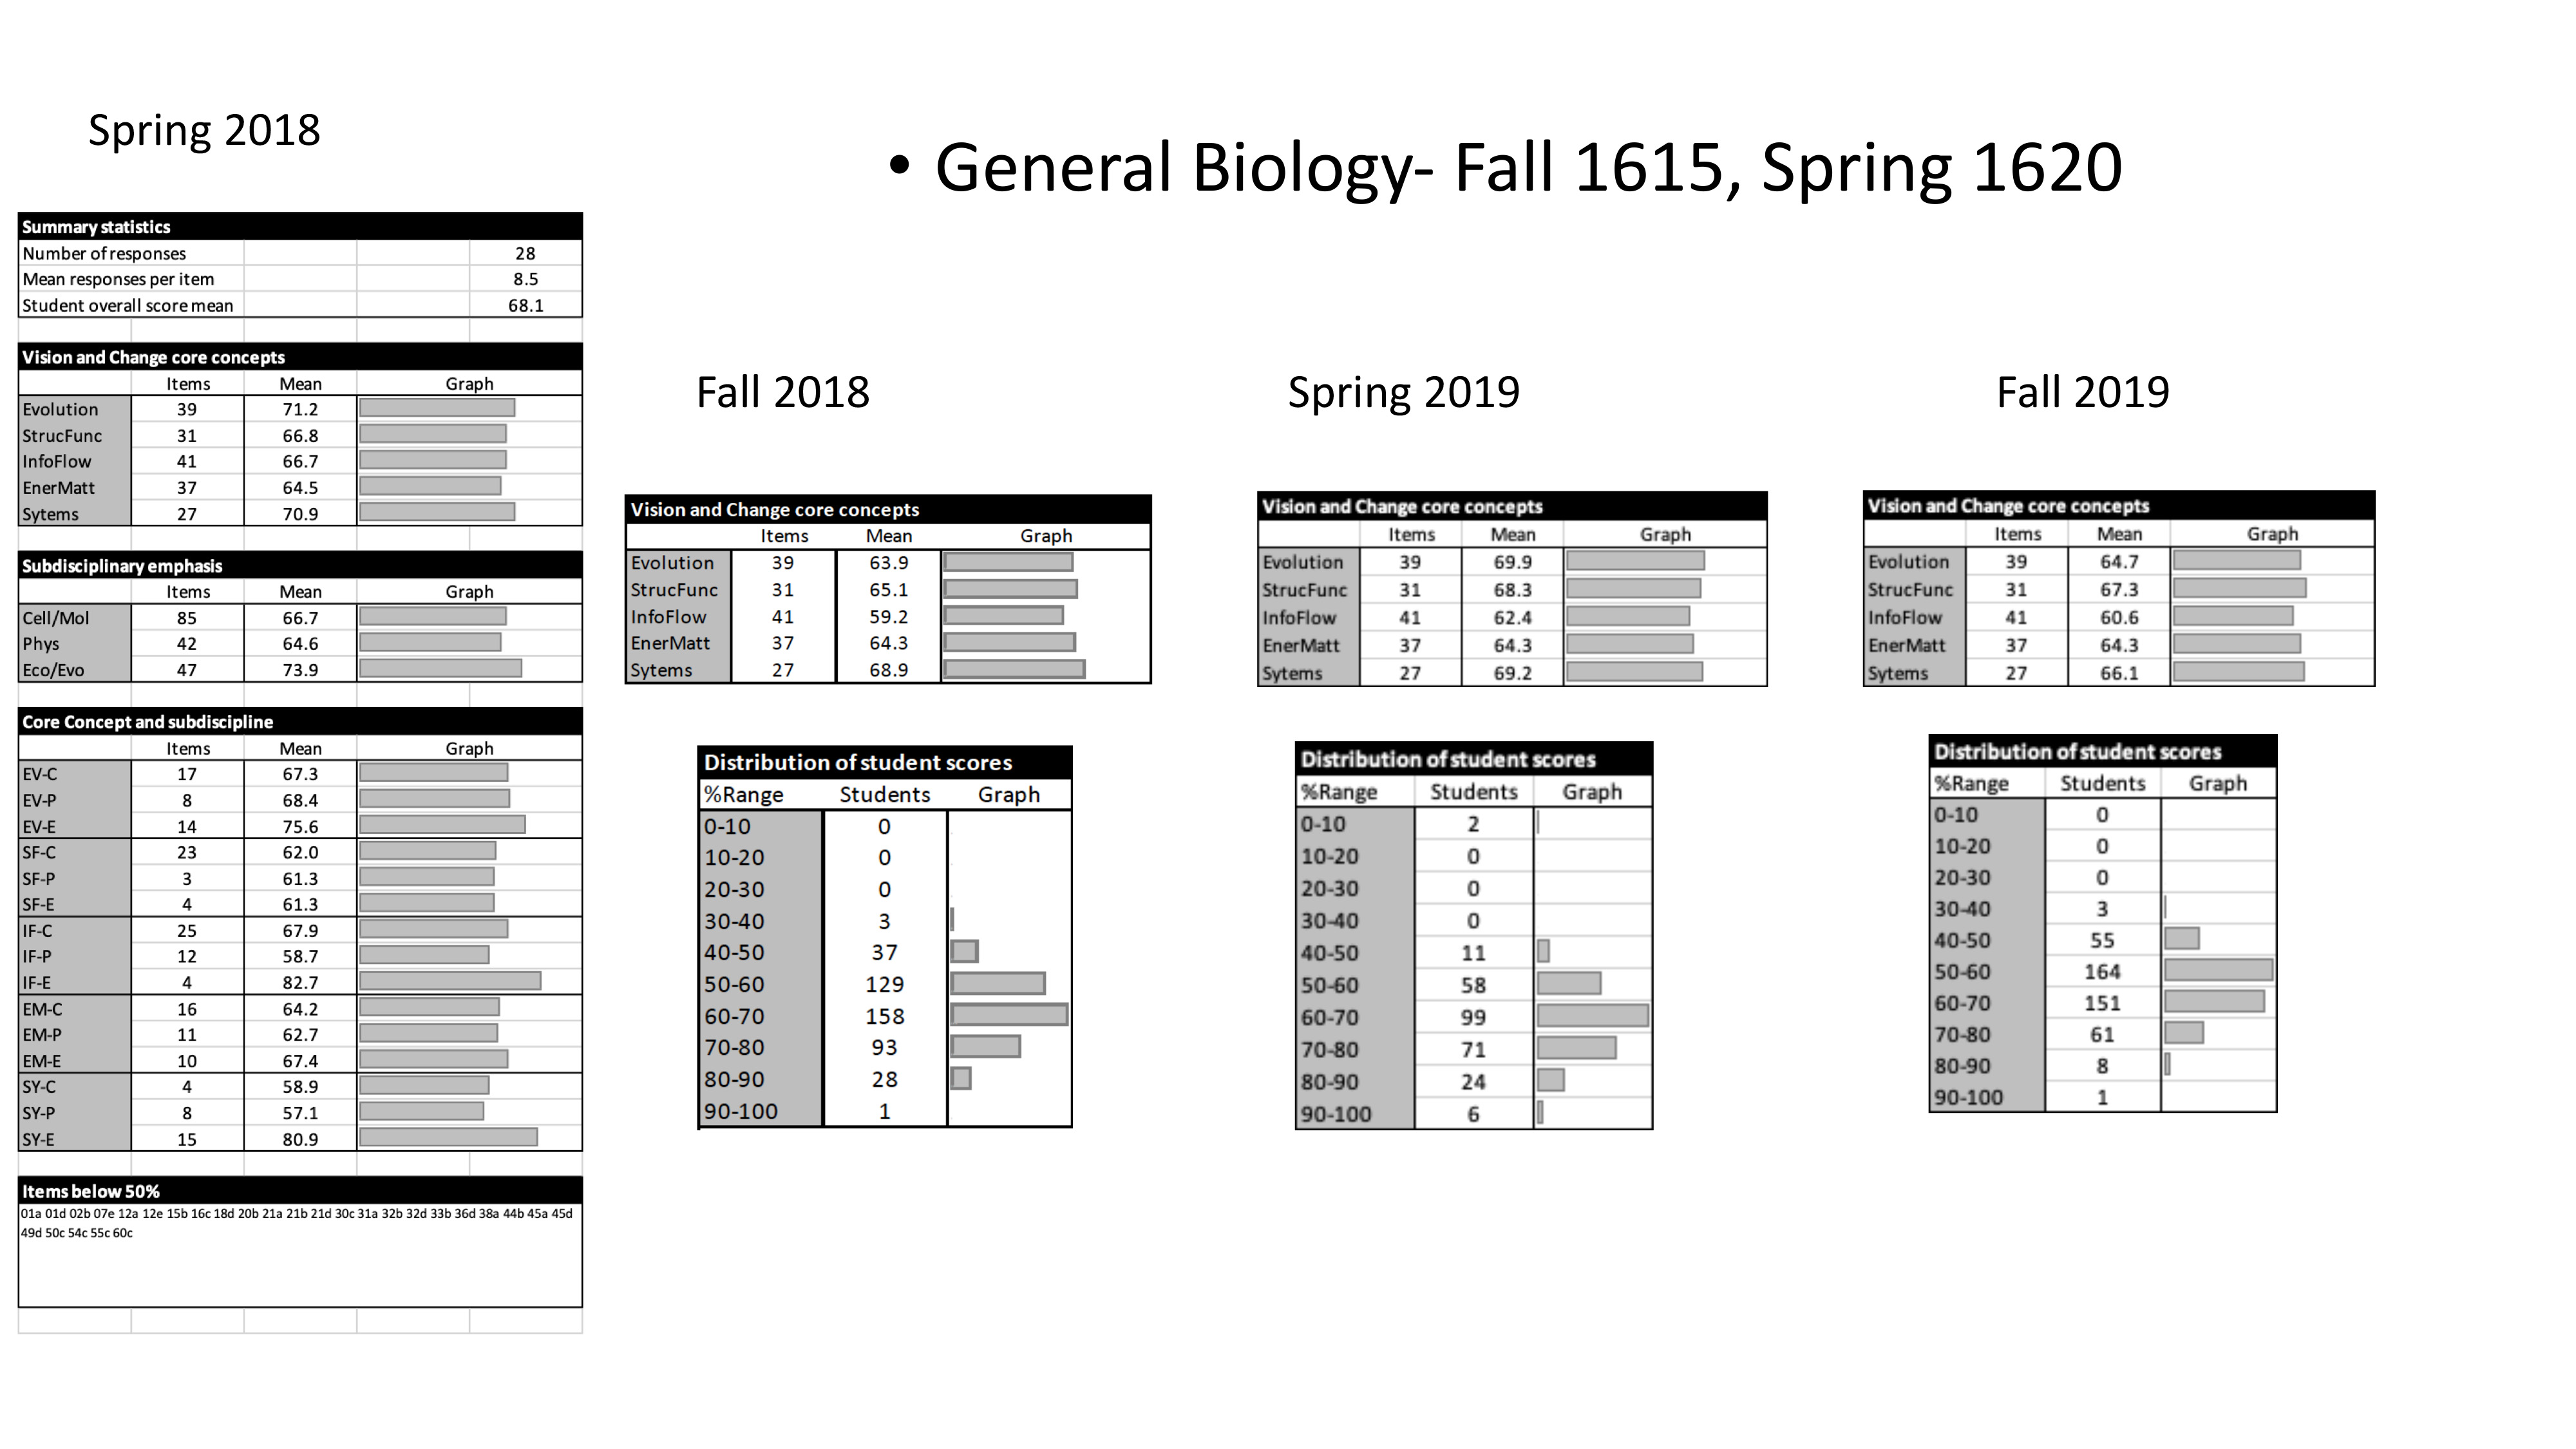
Summaries of other years (The links below show the GenBio-MAPS score sheets for beginning (BIOL 1610), mid (BIOL 1620) and advanced (graduating seniors) in USU biology. USU biology scores in red overlay the national averages that are black and grey):
The following table shows the mean score of upper division or graduating USU students compared to national means of senior levels students from 37 universities.
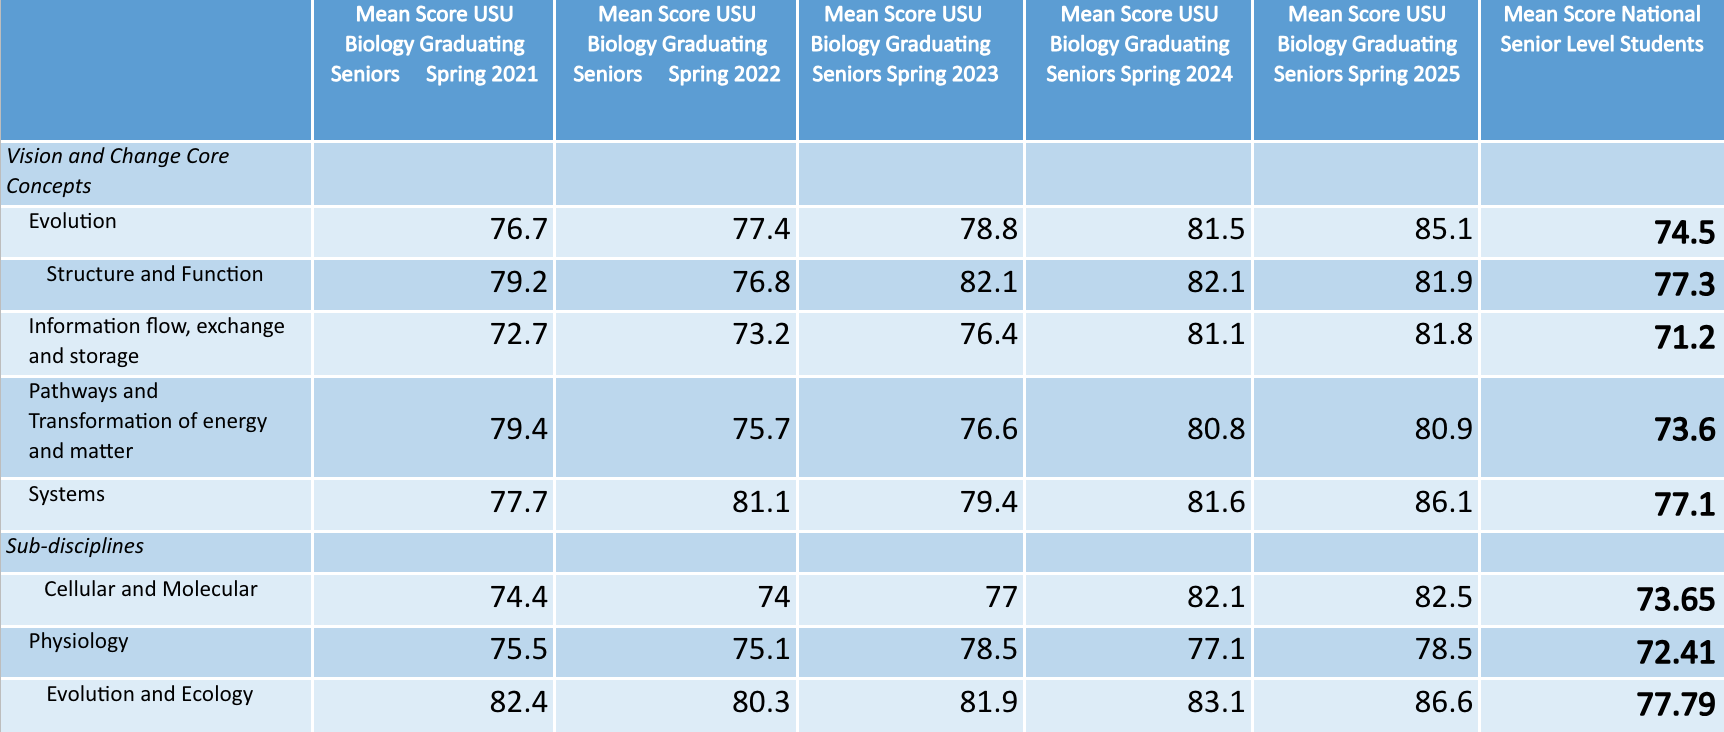
Trends based on the GenBio-MAPS results: Our students compare favorably with the nationally normed sample. Patterns of improvement in recognition and articulation of core concepts in the field of biology could be due to attrition.
Since Spring 2020, we download outcomes data from Canvas at the end of each academic year. We filter the data to analyze data for biology majors only (raw data with A#s excluded: https://usu.box.com/s/m97z1ozncxs1krb2ciqwe5kjxbubouxg). We look at mastery (2/3 score) in as well as improvement across the curriculum. To look at patterns not due to attrition, we track individual student progress (using student A#s) from early to late undergraduate career. We only show results for subobjectives with available early and late scores. For some of the subobjectives, we only have early or late scores but should have the combination of both in the future.
Key to the objectives, subobjectives ,and the courses in the following graphs:
2a Demonstrate how the diversity of life evolved over time via evolutionary mechanisms
2c Explain how the properties of organisms depend on biotic and abiotic information transfer
2d Apply the principles of physics and chemistry to explain how living systems operate
Early scores: Required introductory lecture sequence for biology majors (BIOL 1610 & 1620)
Late scores: Required intermediate courses (BIOL 3020, 3060) in which BIOL 1610/1620 is a prerequisite
Points: Points are average scores across assessments and courses for individual biology majors. The more students with the same score, the darker the point.
Red dashes: Mastery score
Black diagonal lines: Points above the diagonal line show progress over time
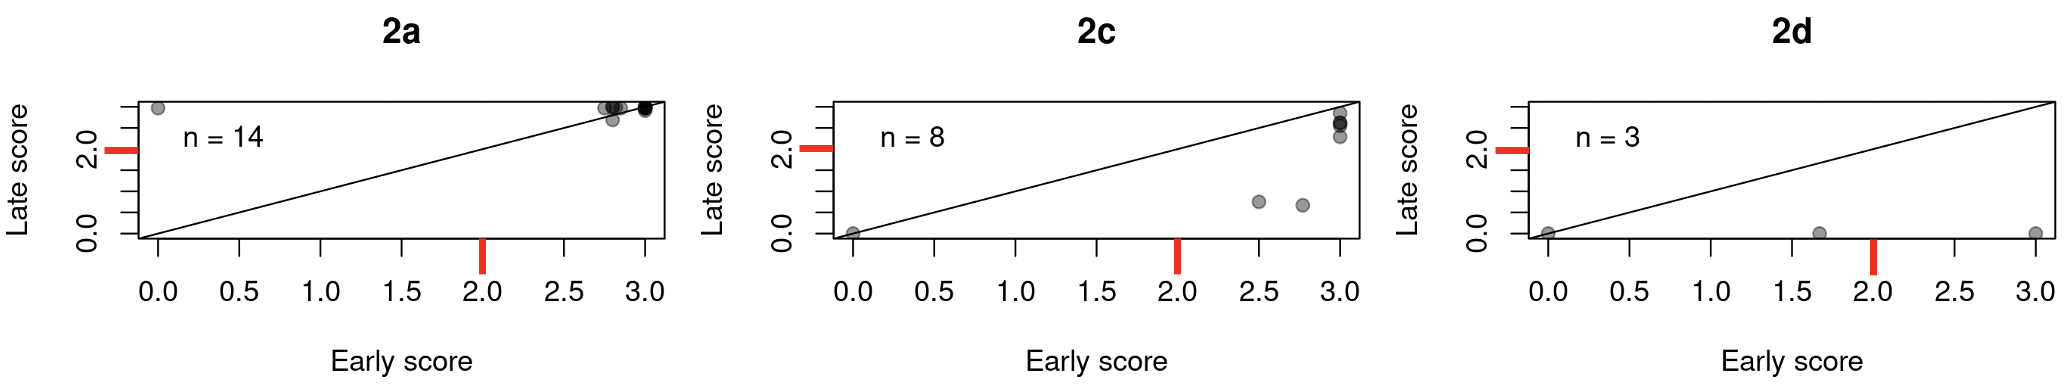
Trends based on these results from Spring 2020-Spring 2025: For objective 2a, most students are improving from early to late courses and most students are mastering this learning objective by the time they take intermediate to upper-level courses. For objectives 2c and 2d, sample sizes are still low. However, overall performance is higher in introductory courses than later courses.
Objective 3b.
Graduates will be able to communicate biological concepts and interpretations to scientists in other disciplines and the general public.
Since Spring 2020, we download outcomes data from Canvas at the end of each academic year. We filter the data to analyze data for biology majors only (raw data with A#s excluded). We look at mastery (2/3 score) in each course as well as improvement across the curriculum. To look at patterns not due to attrition, we track individual student progress (using student A#s) from early to late undergraduate career. We only show results for subobjectives with available early and late scores. For some of the subobjectives, we only have early or late scores but should have the combination of both in the future.
Key to the objectives, subobjectives, and the courses in the following graphs:
3b.1: Writing quality
3b.2: Clear choice of language (oral)
3b.3: Technical use of media, tactical use of media, use of mental images to support (oral) explanation.
Early scores: Required introductory lab sequence for biology majors (BIOL 1615 & 1625)
Late scores: Required intermediate lab courses (BIOL 3020, 3055, 3060, 3065, 3070, 3085) and upper-division elective (BIOL 4060) in which BIOL 1625 is a prerequisite
Points: Points are average scores across assessments and courses for individual biology majors. The more students with the same score, the darker the point.
Red dashes: Mastery score
Black diagonal lines: Points above the diagonal line show progress over time

Trends based on these results from Spring 2020-Spring 2025: Most students are improving from early to late courses, as most points are above the diagonal line. This includes a greater proportion of students mastering objectives in late than early courses, as more late scores are above 2. Importantly, most students are mastering these learning objectives by the time they take intermediate to upper-level courses, as most scores are at or above 2 in the late courses. There is a weak positive correlation for objective 3b.1 (r: 0.29, p-value 0.03); students who did well with writing quality and clear choice of language (oral) early also did so later.
Last updated: October 2025 by L. Lucas & T. Sweeten
Public Health Major - Industrial Hygiene Emphasis
The ABET accredited Industrial Hygiene program in the Biology Department has a long history of evaluating effectiveness in learning by assessing student learning in undergraduate courses taught on the Logan campus specific to their coverage within the program’s emphasis learning objectives. The is a requirement to maintain accreditation. Highlights of the ABET Applied Sciences Outcomes are presented to provide an overview of the attention given to each learning objectives across courses for the Industrial Hygiene emphasis major taught within the department. Outcomes are obtained from standardized exam assessments, internship evaluations, and capstone projects.How well does our program meet ABET Applied Science Outcomes
- Goal to exceed 75%
|
2021-22 |
2022-23 |
2023-24 |
2024-25 |
2025-26 |
2026-27 |
2021-2027 |
||
|
An ability to identify, formulate, and solve broadly defined technical or scientific problems by applying knowledge of mathematics and science and/or technical topics to areas relevant to the discipline. |
Aggregate Score |
87% |
||||||
|
Alumni (Q8,9) |
100% |
100% |
|
|
|
|
100% |
|
|
An ability to apply knowledge of mathematics, science, and applied sciences |
student evaluated data |
80% |
84% |
88% |
|
|
|
84% |
|
internship |
94% |
91% |
93% |
|
|
|
93% |
|
|
An ability to identify and solve applied science problems |
student evaluated data |
81% |
82% |
87% |
|
|
|
83% |
|
An ability to formulate or design a system, process or program to meet desired needs |
Aggregate Score |
91% |
||||||
|
Alumni (Q11) |
100% |
100% |
|
|
|
|
100% |
|
|
student evaluated data |
88% |
83% |
74% |
|
|
|
82% |
|
|
internship |
95% |
90% |
91% |
|
|
|
92% |
|
|
An ability to develop and conduct experiments or test hypotheses, analyze and interpret data and use scientific judgment to draw conclusions. |
Aggregate Score |
91% |
||||||
|
Alumni (Q10,12) |
100% |
100% |
|
|
|
|
100% |
|
|
An ability to design and conduct experiments, as well as to analyze and interpret data |
student evaluated data |
81% |
83% |
84% |
|
|
|
83% |
|
internship |
96% |
87% |
92% |
|
|
|
92% |
|
|
An ability to use the techniques, skills, and modern scientific and technical tools necessary for professional practice. |
student evaluated data |
87% |
92% |
92% |
|
|
|
90% |
|
An ability to communicate effectively with a range of audiences |
Aggregate Score |
92% |
||||||
|
Alumni (Q13) |
90% |
100% |
|
|
|
|
95% |
|
|
An ability to communicate effectively |
student evaluated data |
90% |
92% |
91% |
|
|
|
91% |
|
|
internship |
95% |
81% |
91% |
|
|
|
89% |
|
An ability to understand ethical and professional responsibilities and the impact of technical and/or scientific solutions in global, economic, environmental, and societal contexts. |
Aggregate Score |
93% |
||||||
|
An understanding of professional and ethical responsibility |
student evaluated data |
86% |
90% |
90% |
|
|
|
89% |
|
Alumni (Q14,15) |
95% |
100% |
|
|
|
|
98% |
|
|
ethical responsibility |
internship |
93% |
94% |
97% |
|
|
|
95% |
|
professional responsibilities |
internship |
96% |
92% |
94% |
|
|
|
94% |
|
The broad education necessary to understand the impact of solutions in a global and societal context |
Alumni (Q16) |
100% |
100% |
|
|
|
|
100% |
|
student evaluated data |
84% |
85% |
84% |
|
|
|
84% |
|
|
Recognize the need for, and an ability to engage in life-long learning |
student evaluated data |
82% |
93% |
93% |
|
|
|
89% |
|
An ability to function effectively on teams that establish goals, plan tasks, meet deadlines, and analyze risk and uncertainty. |
Aggregate Score |
95% |
||||||
|
Alumni (Q17,18) |
95% |
100% |
98% |
|||||
|
An ability to function effectively on multidisciplinary teams … |
internship |
94% |
88% |
93% |
|
|
|
92% |
|
|
student evaluated data |
79% |
82% |
88% |
|
|
|
83% |
How well does our program meet ABET IH Outcomes
The Curriculum must provide graduates with the necessary knowledge of Industrial Hygiene and include the following curricular areas.
|
Goal to exceed 75% |
2021-2022 |
2022-2023 |
2023-2024 |
2024-2025 |
2025-2026 |
2026-2027 |
2021-2027 |
|
|
Physiological and/or toxicological interactions of physical, chemical, biological, and ergonomic agents, factors, and/or stressors with the human body. |
Aggregate Score |
86% |
||||||
|
Alumni (Q20,21,22,23) |
100% |
96% |
|
|
|
|
98% |
|
|
identify agents, factors, and stressors generated by and/or associated with defined sources, unit operations, and/or processes. |
student evaluated data |
78% |
85% |
89% |
|
|
|
84% |
|
understand physiological and/or toxicological interactions of physical, chemical, biological, and ergonomic agents, factors, and/or stressors with the human body. |
internship |
93% |
85% |
91% |
|
|
|
90% |
|
student evaluated data |
77% |
86% |
91% |
|
|
|
85% |
|
|
Anticipation, recognition, evaluation, and control of potentially hazardous agents, conditions and practices. |
Aggregate Score |
91% |
||||||
|
recommend and evaluate engineering, administrative, and personal protective equipment controls and/or other interventions to reduce or eliminate hazards. |
Alumni (Q24A,B,C,D) |
100% |
100% |
|
|
|
|
100% |
|
internship |
88% |
87% |
90% |
|
|
|
88% |
|
|
student evaluated data |
82% |
84% |
84% |
|
|
|
83% |
|
|
Fundamental exposure assessment techniques (both qualitative and quantitative). |
Aggregate Score |
90% |
||||||
|
describe qualitative and quantitative aspects of generation of agents, factors, and stressors. |
student evaluated data |
84% |
81% |
86% |
|
|
|
84% |
|
assess qualitative and quantitative aspects of exposure assessment, dose-response, and risk characterization based on applicable pathways and modes of entry. |
Alumni (Q25A,25B) |
95% |
100% |
|
|
|
|
98% |
|
internship |
87% |
89% |
92% |
|
|
|
89% |
|
|
student evaluated data |
86% |
91% |
91% |
|
|
|
89% |
|
|
Industrial Hygiene data interpretation including statistical and epidemiological principles. |
Aggregate Score |
88% |
||||||
|
calculate, interpret, and apply statistical and epidemiological data. |
Alumni (Q26A,26B) |
95% |
96% |
|
|
|
|
96% |
|
student evaluated data |
79% |
79% |
81% |
|
|
|
80% |
|
|
applicable business and managerial practices. |
Aggregate Score |
86% |
||||||
|
demonstrate an understanding of applicable business and managerial practices. |
Alumni (Q27) |
90% |
100% |
|
|
|
|
95% |
|
student evaluated data |
91% |
93% |
93% |
|
|
|
92% |
|
|
internship |
90% |
88% |
89% |
|
|
|
89% |
|
|
importance to attain recognized professional certification. |
student evaluated data |
82% |
93% |
93% |
|
|
|
89% |
|
Goal is to be certified at 50% or greater at 6 yrs post graduation ** |
external |
60% |
81% |
82% |
61% |
56% |
46% |
64% |
|
2016 |
2017 |
2018 |
2019 |
2020 |
2021 |
|
||
|
Occupational and environmental standards and regulations |
Aggregate Score |
90% |
||||||
|
interpret and apply applicable occupational and environmental regulations. |
Alumni (Q28,Q29 |
100% |
89% |
|
|
|
|
95% |
|
student evaluated data |
85% |
87% |
90% |
|
|
|
87% |
|
|
internship |
90% |
89% |
89% |
|
|
|
89% |
|
|
fundamental aspects of safety and environmental health |
Aggregate Score |
89% |
||||||
|
understand fundamental aspects of safety and environmental health. |
Alumni (Q30,Q31) |
100% |
78% |
|
|
|
|
89% |
|
student evaluated data |
87% |
91% |
90% |
|
|
|
89% |
|
|
safety |
internship |
90% |
91% |
92% |
|
|
|
91% |
|
environmental health |
internship |
90% |
78% |
90% |
|
|
|
86% |