Outcomes Data
We collect data primarily from the APDP and the exit surveys, along with comprehensive exam and thesis/dissertation defense records. The APDP is collected every year for each student, so can show the trajectory as students progress through the program. The other data are from a single point in time. All data are anonymized, summarized, and displayed (in both table and visual format) on the department website by the end of each Fall semester. Graduate Program Co-Directors are responsible for data summaries, analysis, and visualization. Data are summarized, analyzed, and visualized independently for each of our four programs (Biology PhD/MS, Ecology PhD/MS). Once the data are posted, a link is shared with faculty, staff, and students in the department so that they may view progress toward Learning Outcomes for themselves.
The tables below identify the data we collect, from where we obtain it, and the responsible party.
| Metric | What we need | Where to get it | Who can get it |
|---|---|---|---|
| Proportion of students passing comprehensive exams | Records of examination | Graduate School | GPC |
| Proportion of students passing thesis/dissertation defense | Records of examination | Graduate School | GPC |
| Proportion of students performing At or Above expectations for each outcome, as decided by the supervisory committee on the APDP | Biology APDP records | Biology Department | GPC |
| Proportion of students performing At or Above expectations for each outcome, as determined by self-assessment on the APDP | Biology APDP records | Biology Department | GPC |
| Proportion of graduating students that answer satisfied or very satisfied to each question in an exit interview | Exit interview survey records | Biology Department | GPC |
Program Statistics & Information
- Biology Graduate Student Dissertations
- Biology Graduate Student Presentations and Publications
- Biology Graduate Student Enrollment by Degree, Total and Percentages
- Graduate Program Applications – Acceptances and Enrollment
- Biology Graduate Student Enrollment by Gender, Totals and Percentages
- Biology Graduate Student Enrollment by Ethnicity and Gender
- Graduate Program Applicants – Average GRE, GPA, and TOEFL for entering Graduate Students, Fall Semester
- Biology Graduate Program Degrees Conferred – Time-to-Completion
Biology Graduate Degrees Granted
|
Year |
MS |
PhD |
|
2021 |
3 |
5 |
|
2022 |
7 |
4 |
|
2023 |
10 |
8 |
|
2024 |
3 |
5 |
Average Number of Publications per student at graduation
|
Year |
MS |
PhD |
|
2021 |
NA* |
7.75 |
|
2022 |
0 |
12 |
|
2023 |
6 |
7.28 |
|
2024 |
5.4 |
4.6 |
Average Number of Total Presentations per student at graduation
|
Year |
MS |
PhD |
|
2021 |
NA* |
6.75 |
|
2022 |
3 |
10.5 |
|
2023 |
12 |
6 |
|
2024 |
8.8 |
7 |
Average Number of Grants and Awards per student at graduation
|
Year |
MS |
PhD |
|
2021 |
NA* |
3.25 |
|
2022 |
3 |
6.25 |
|
2023 |
5 |
6.43 |
|
2024 |
7.6 |
6.8 |
*unable to retrieve outcomes data for MS students from this year
Current outcomes data for graduate students in Biology
Data shown are from exit surveys of Biology Program graduates through Spring 2024
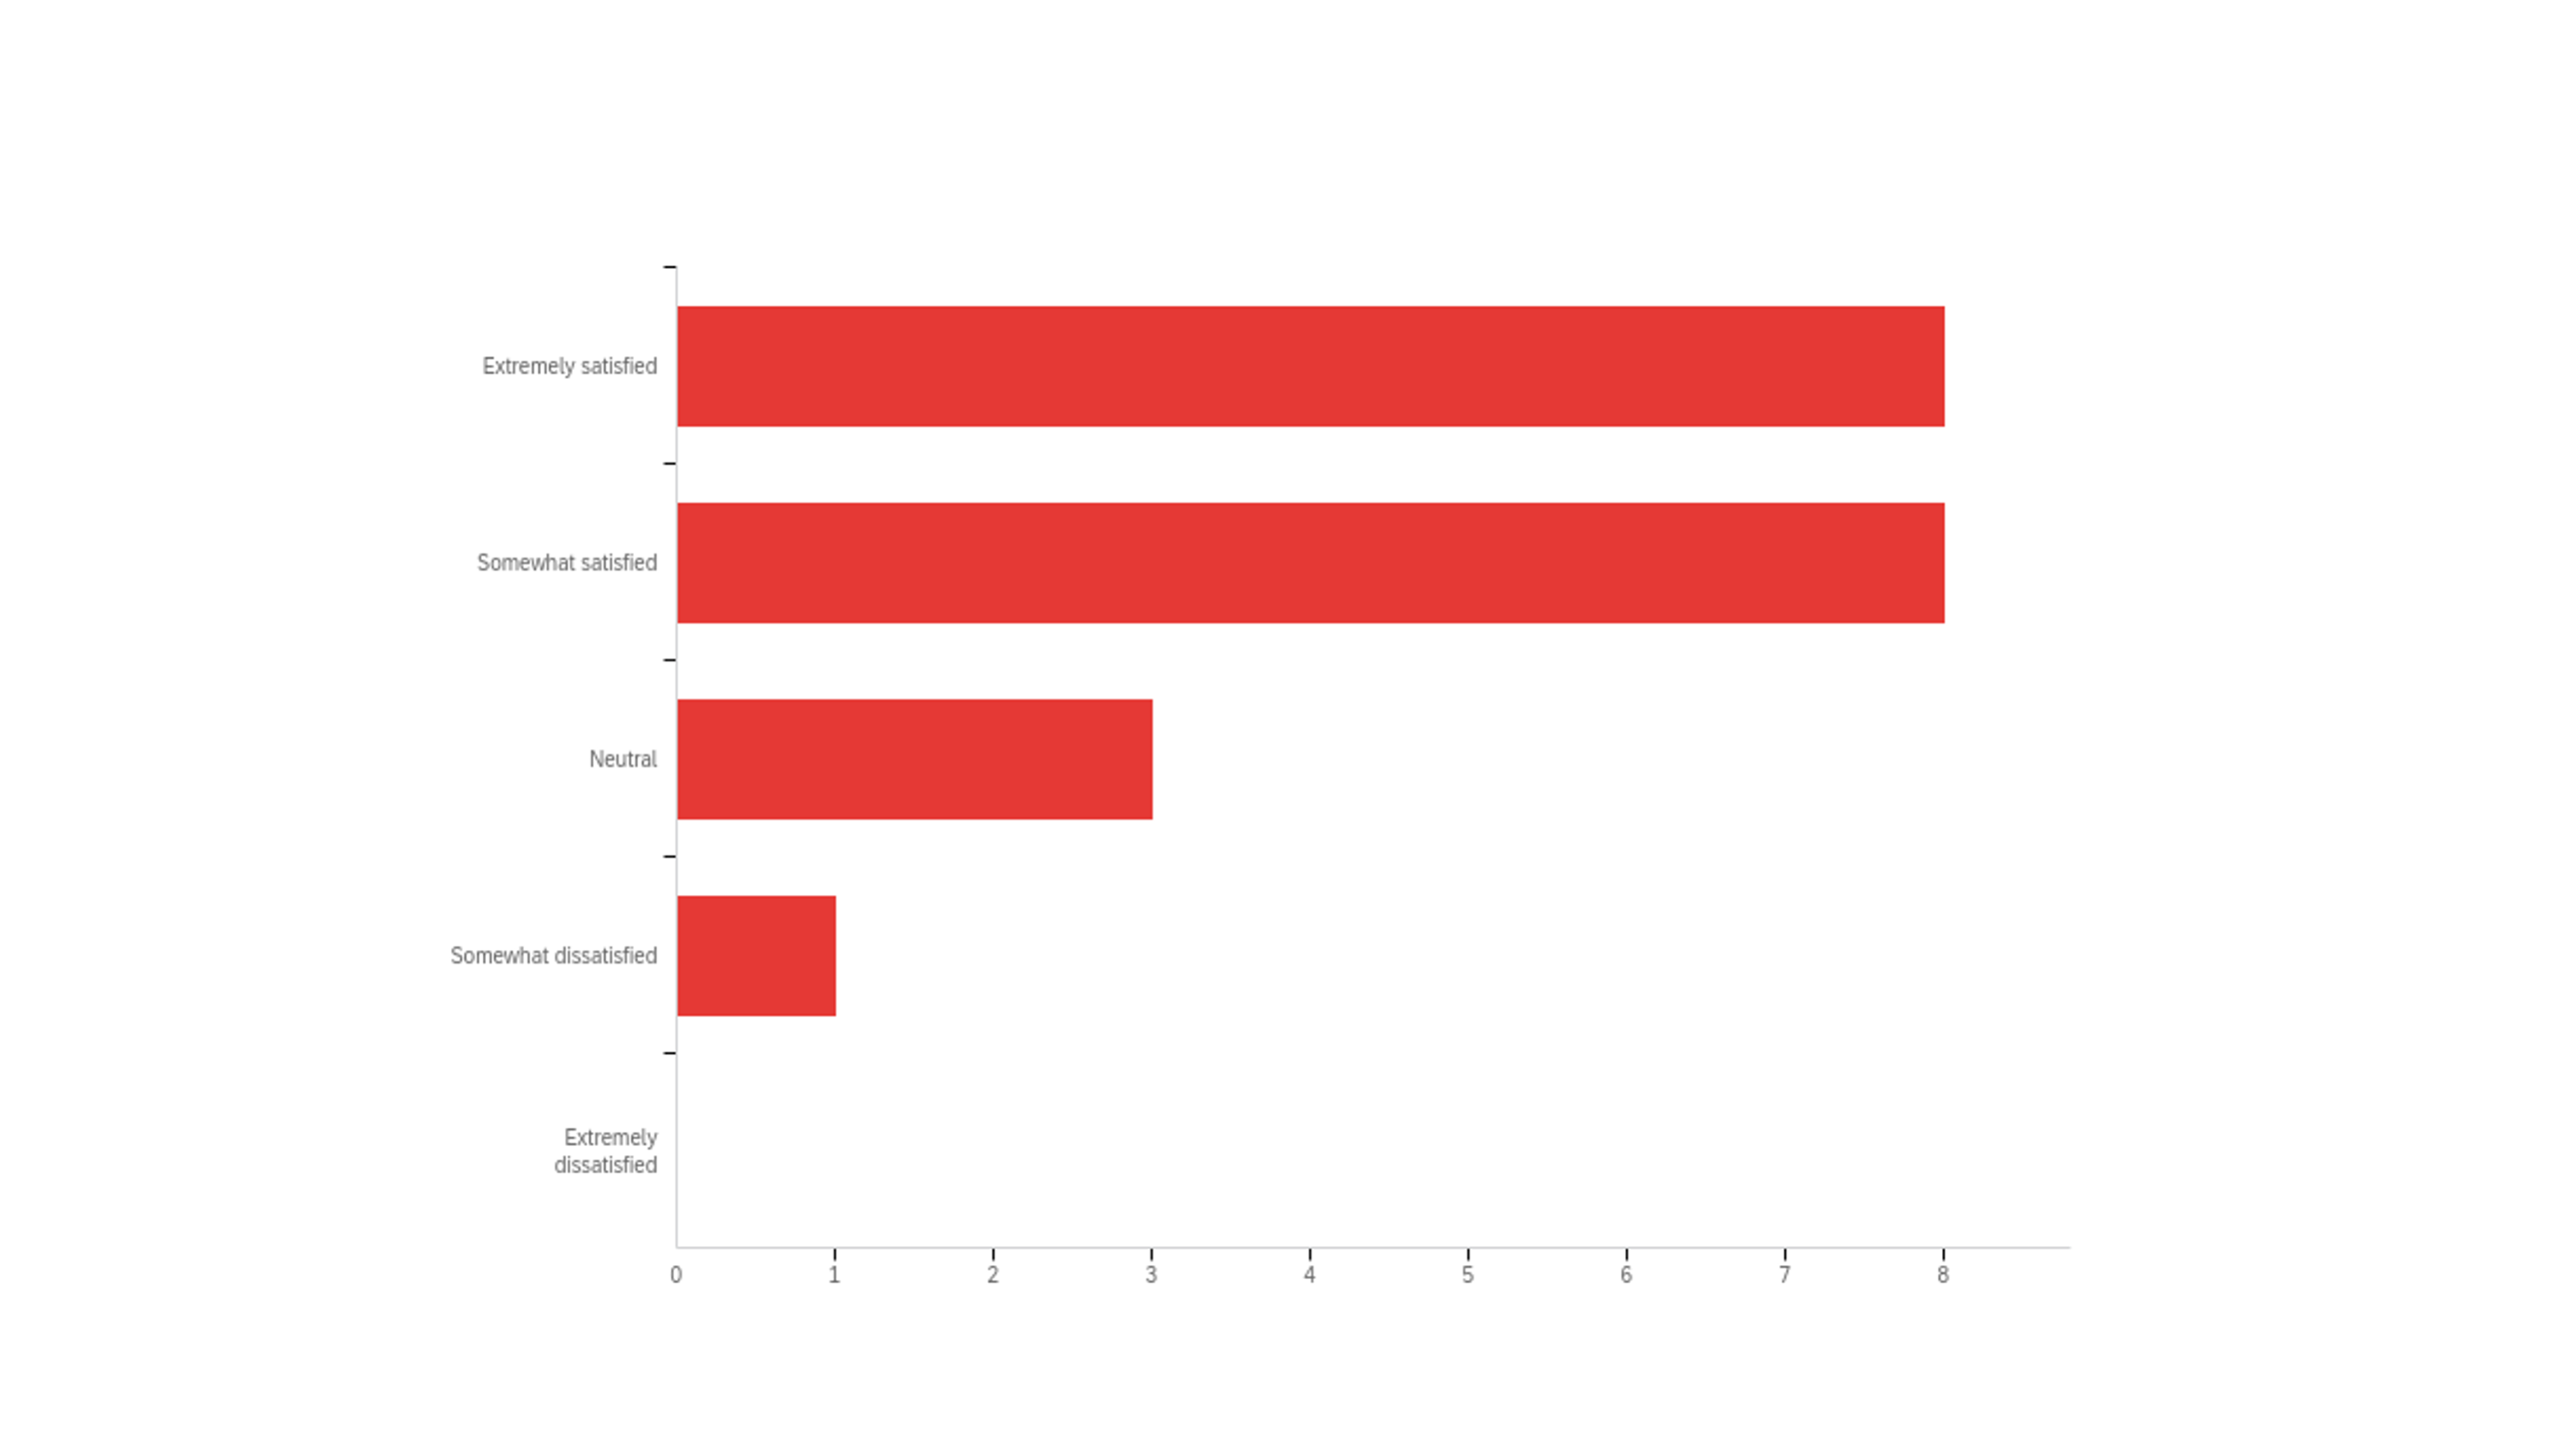
Fig. 1 - Biology graduate student responses to the query: How satisfied are you that your graduate program increased your confidence in the ability to design and implement a research project?
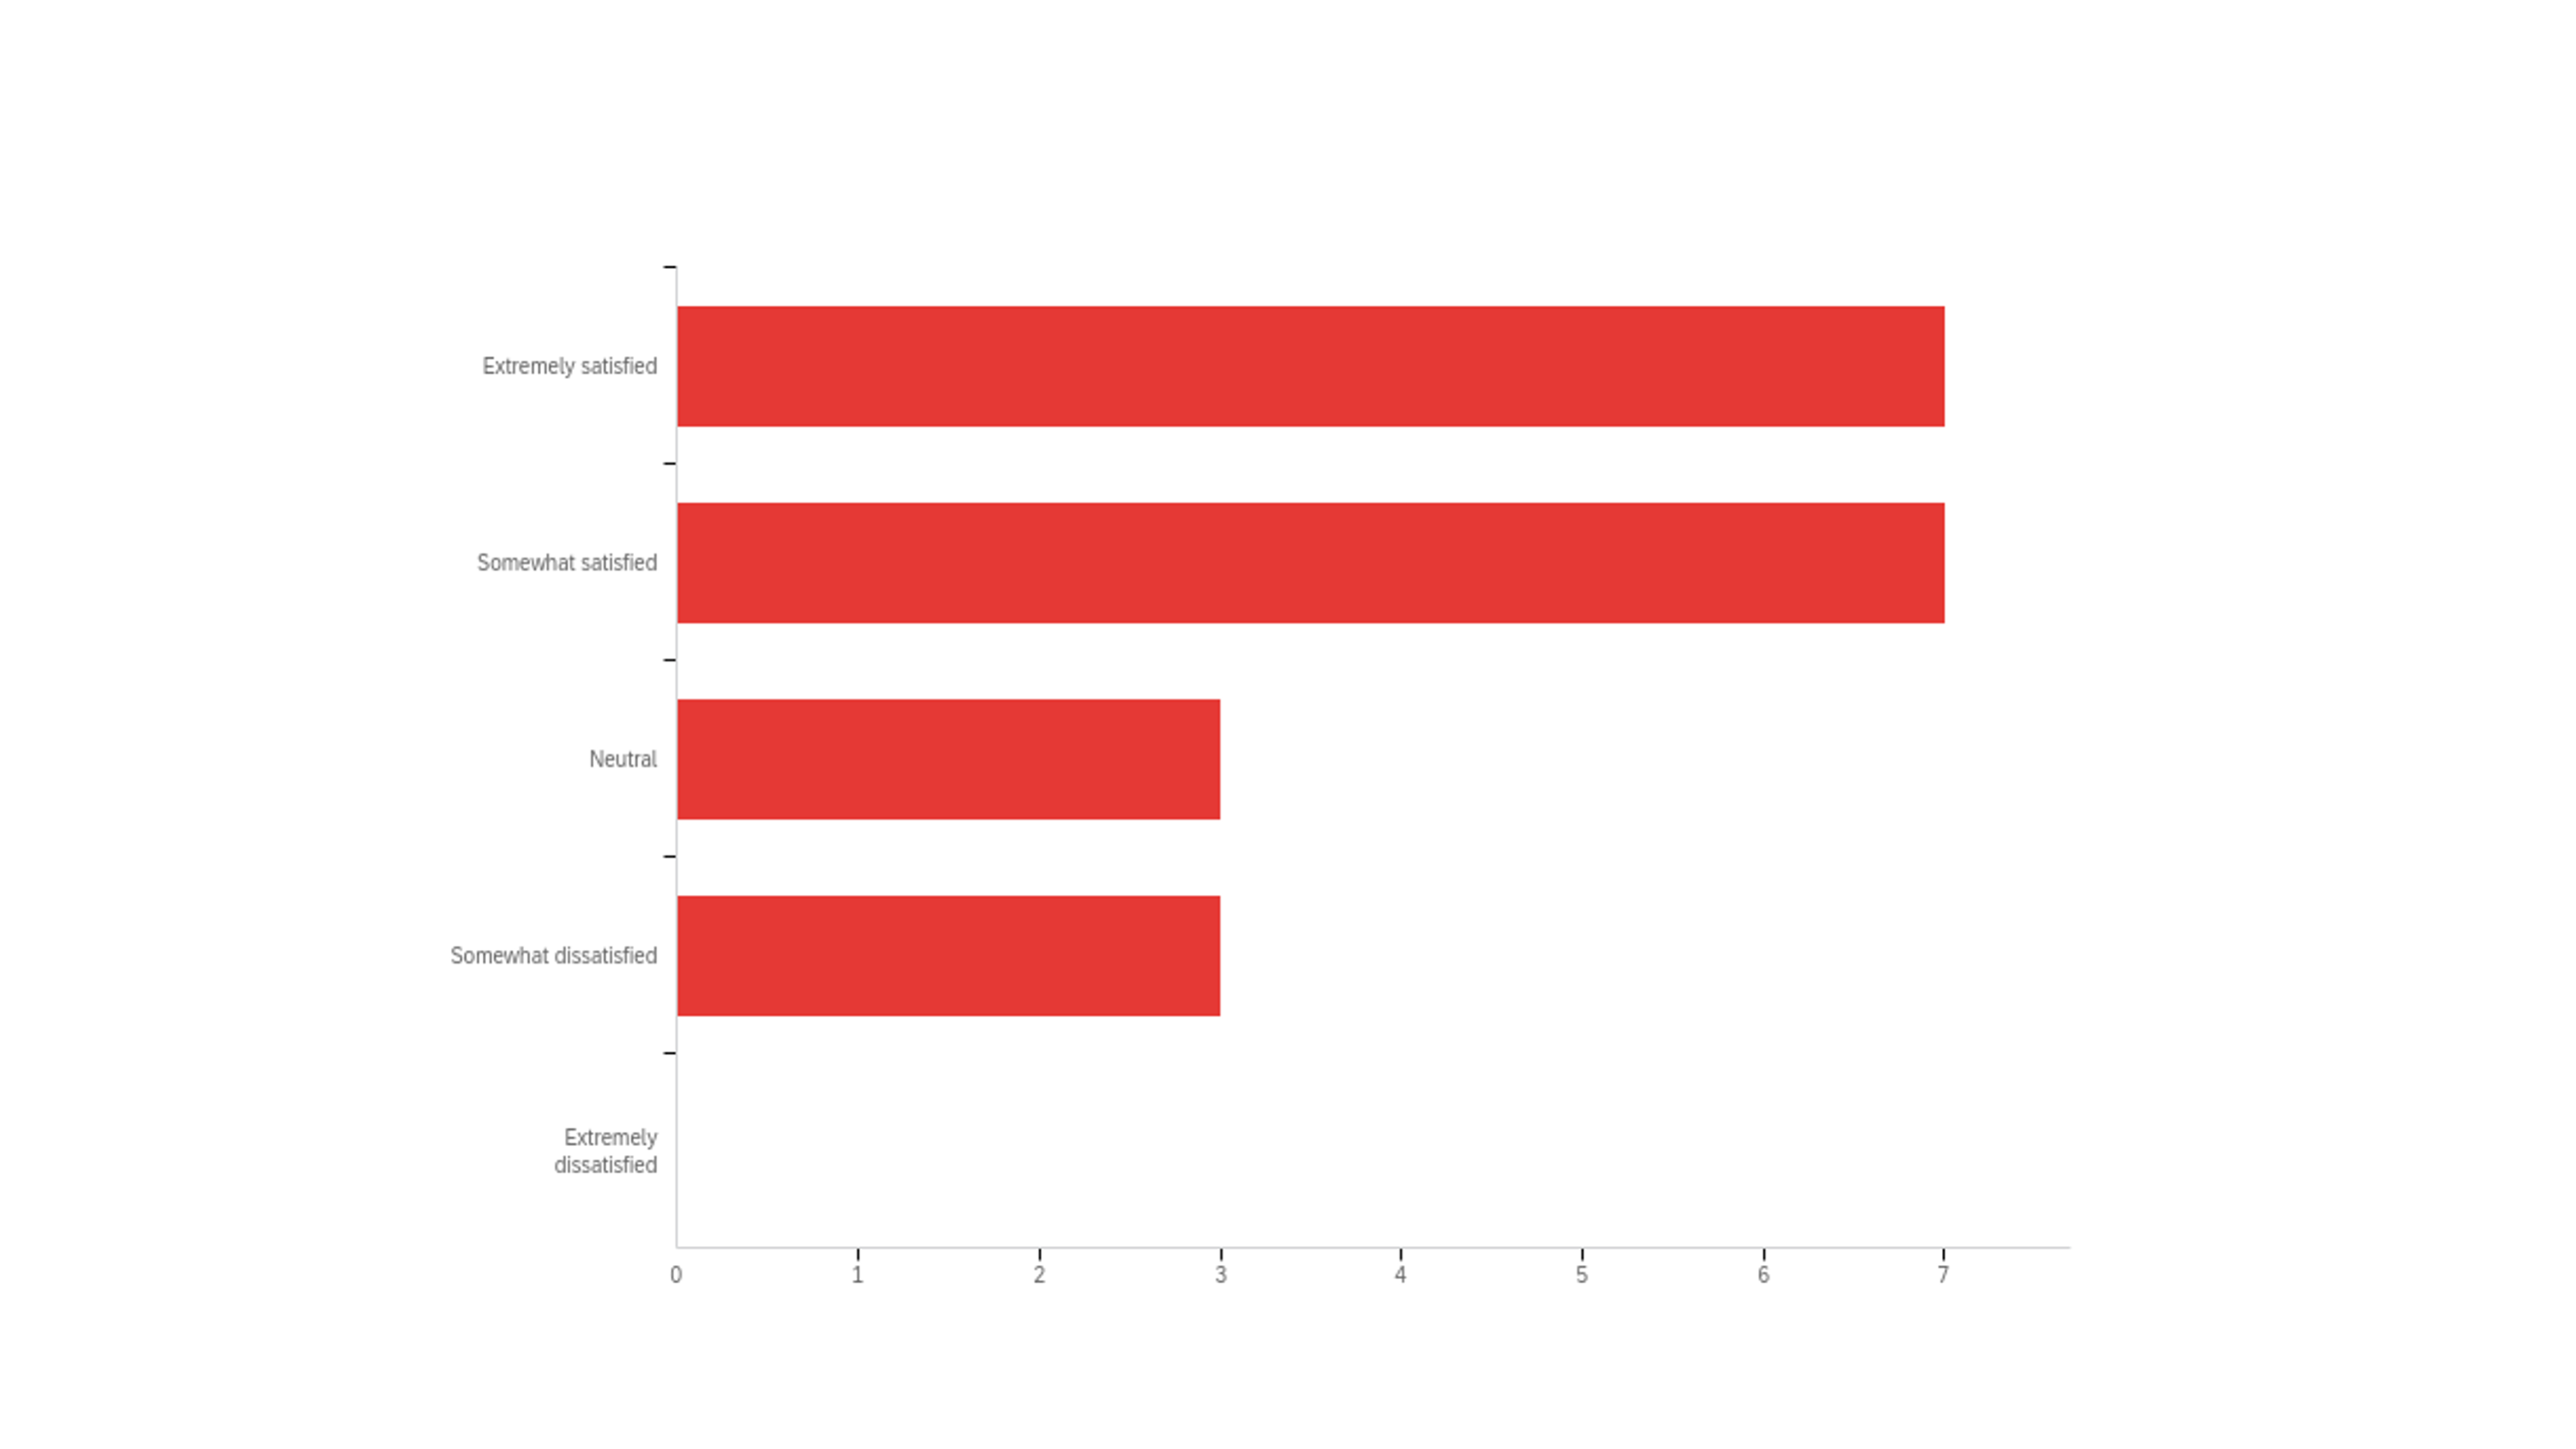
Fig. 2 - Biology graduate student responses to the query: How satisfied are you that your graduate program helped you learn and practice the skills necessary to prepare you for a job in your field?
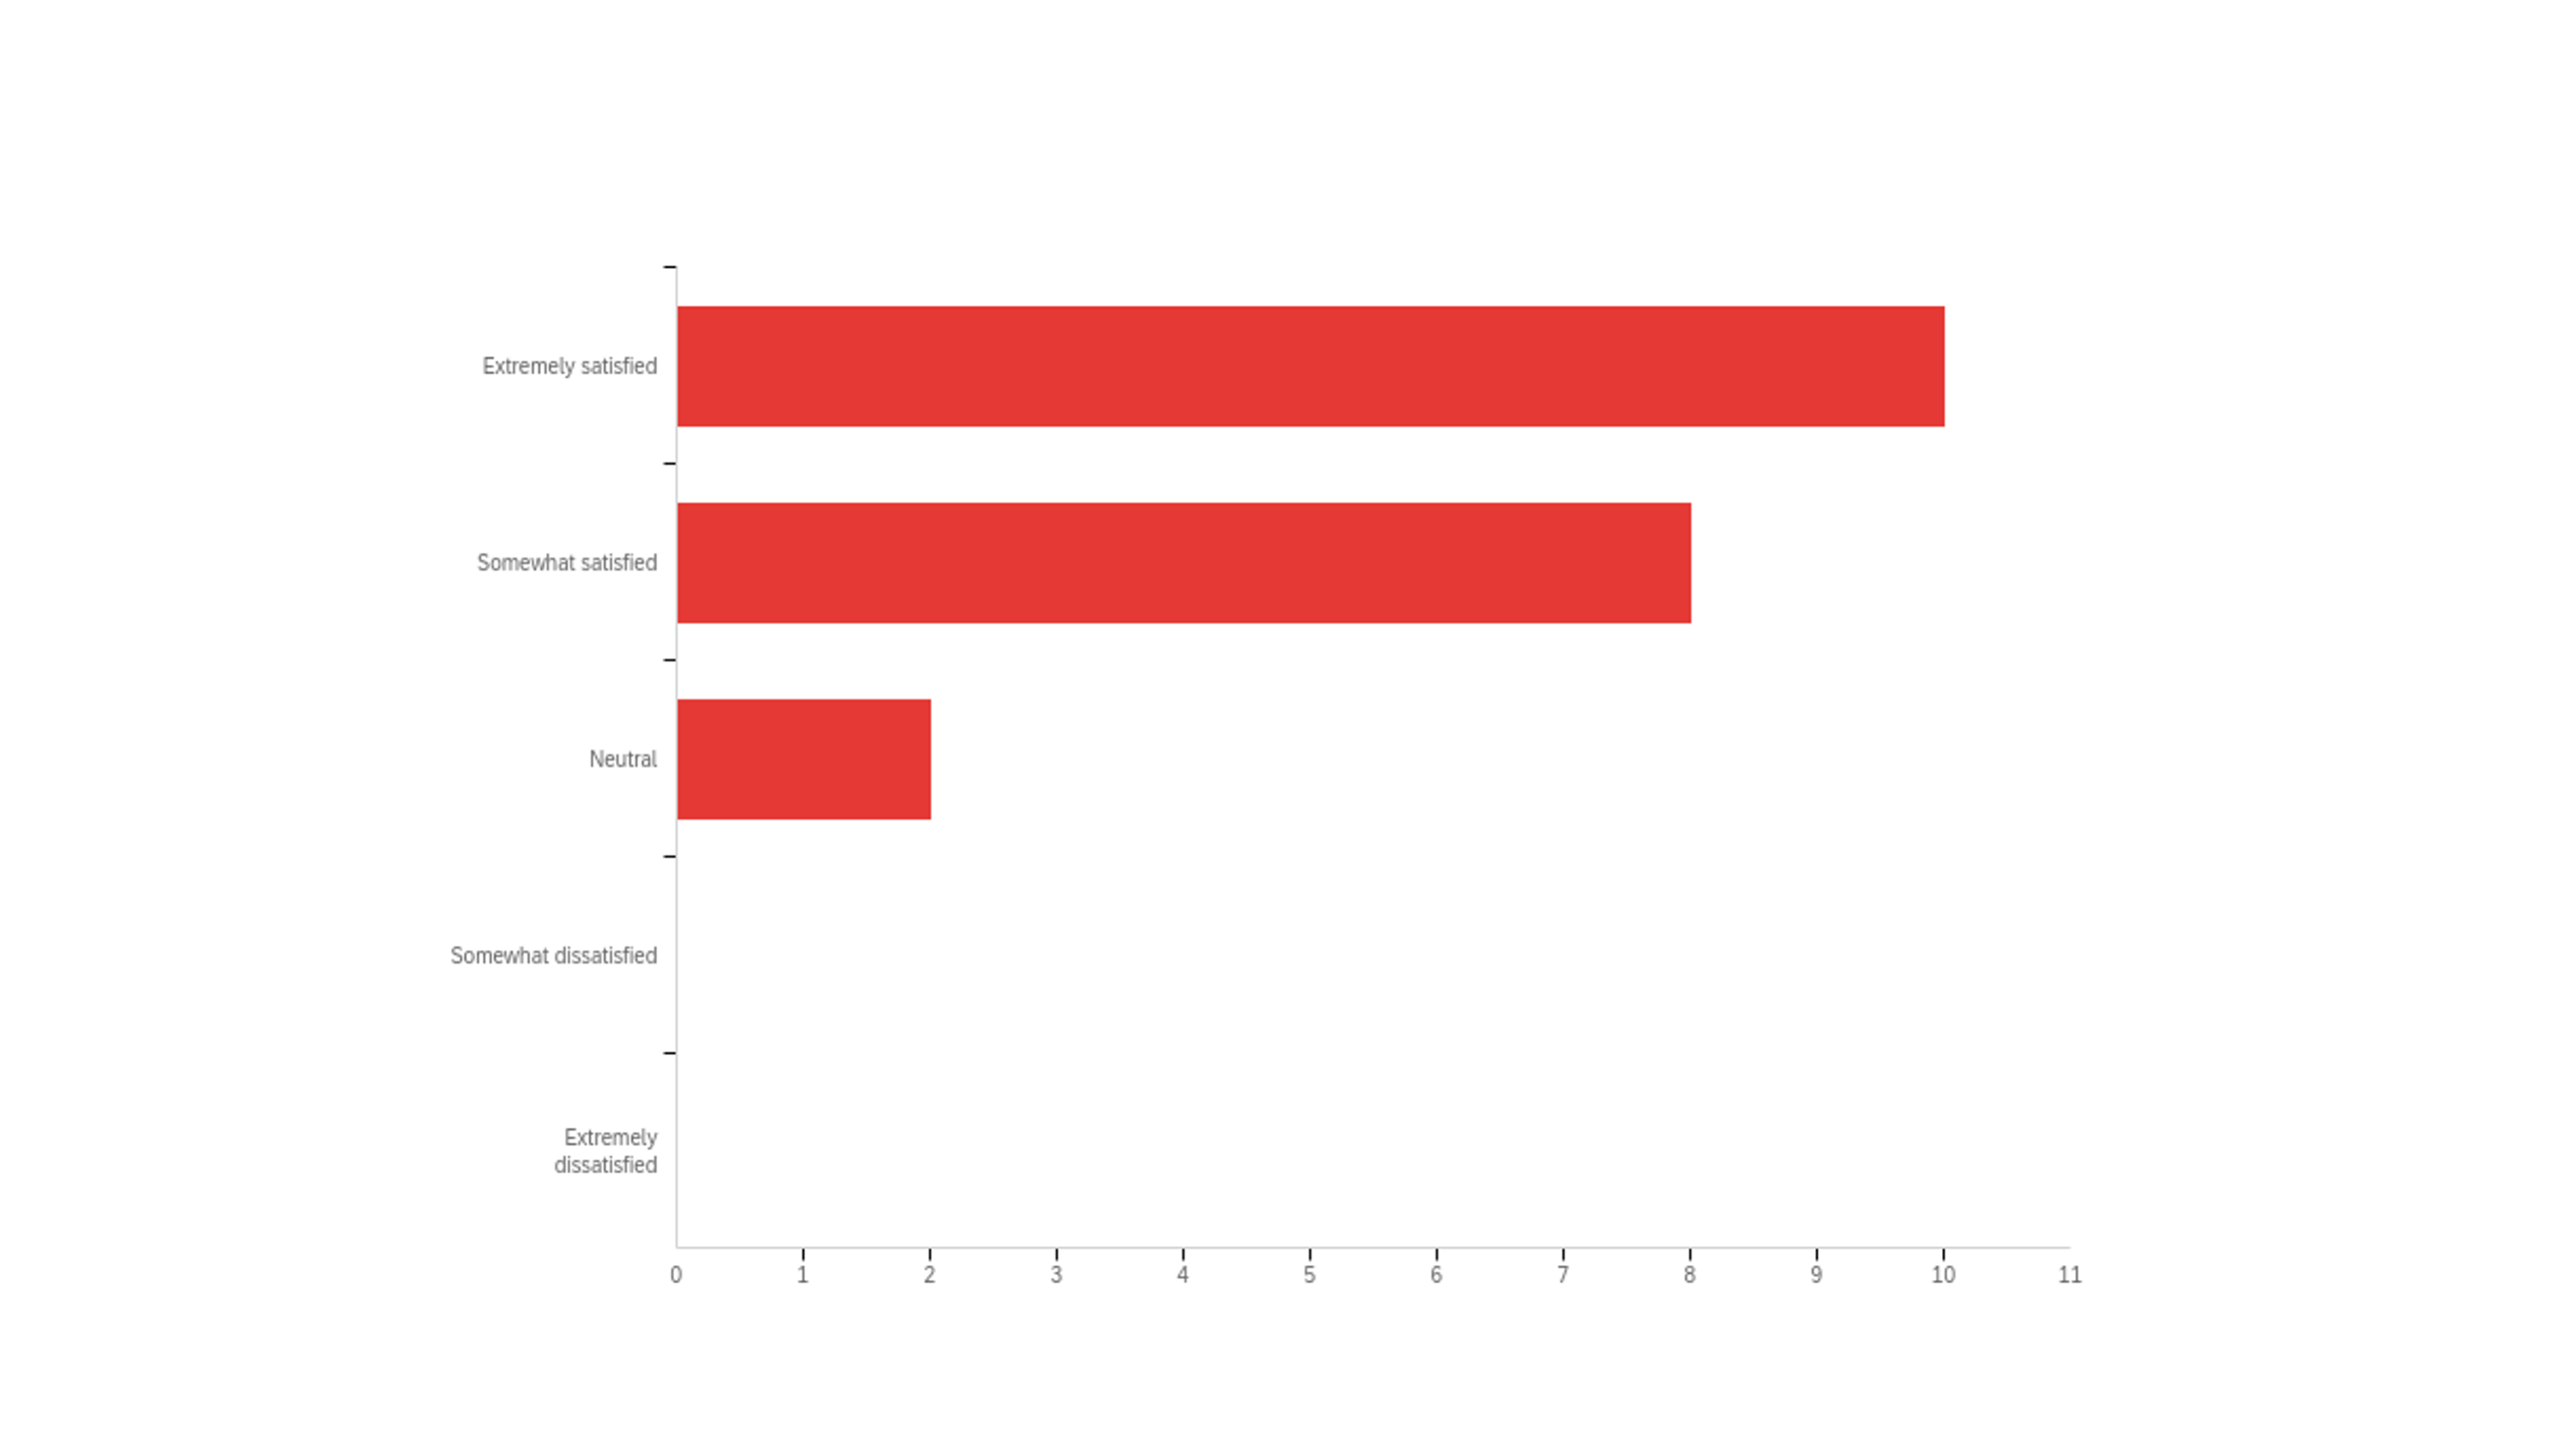
Fig. 3 - Biology graduate student responses to the query: How satisfied are you that your graduate program improved your writing skills?
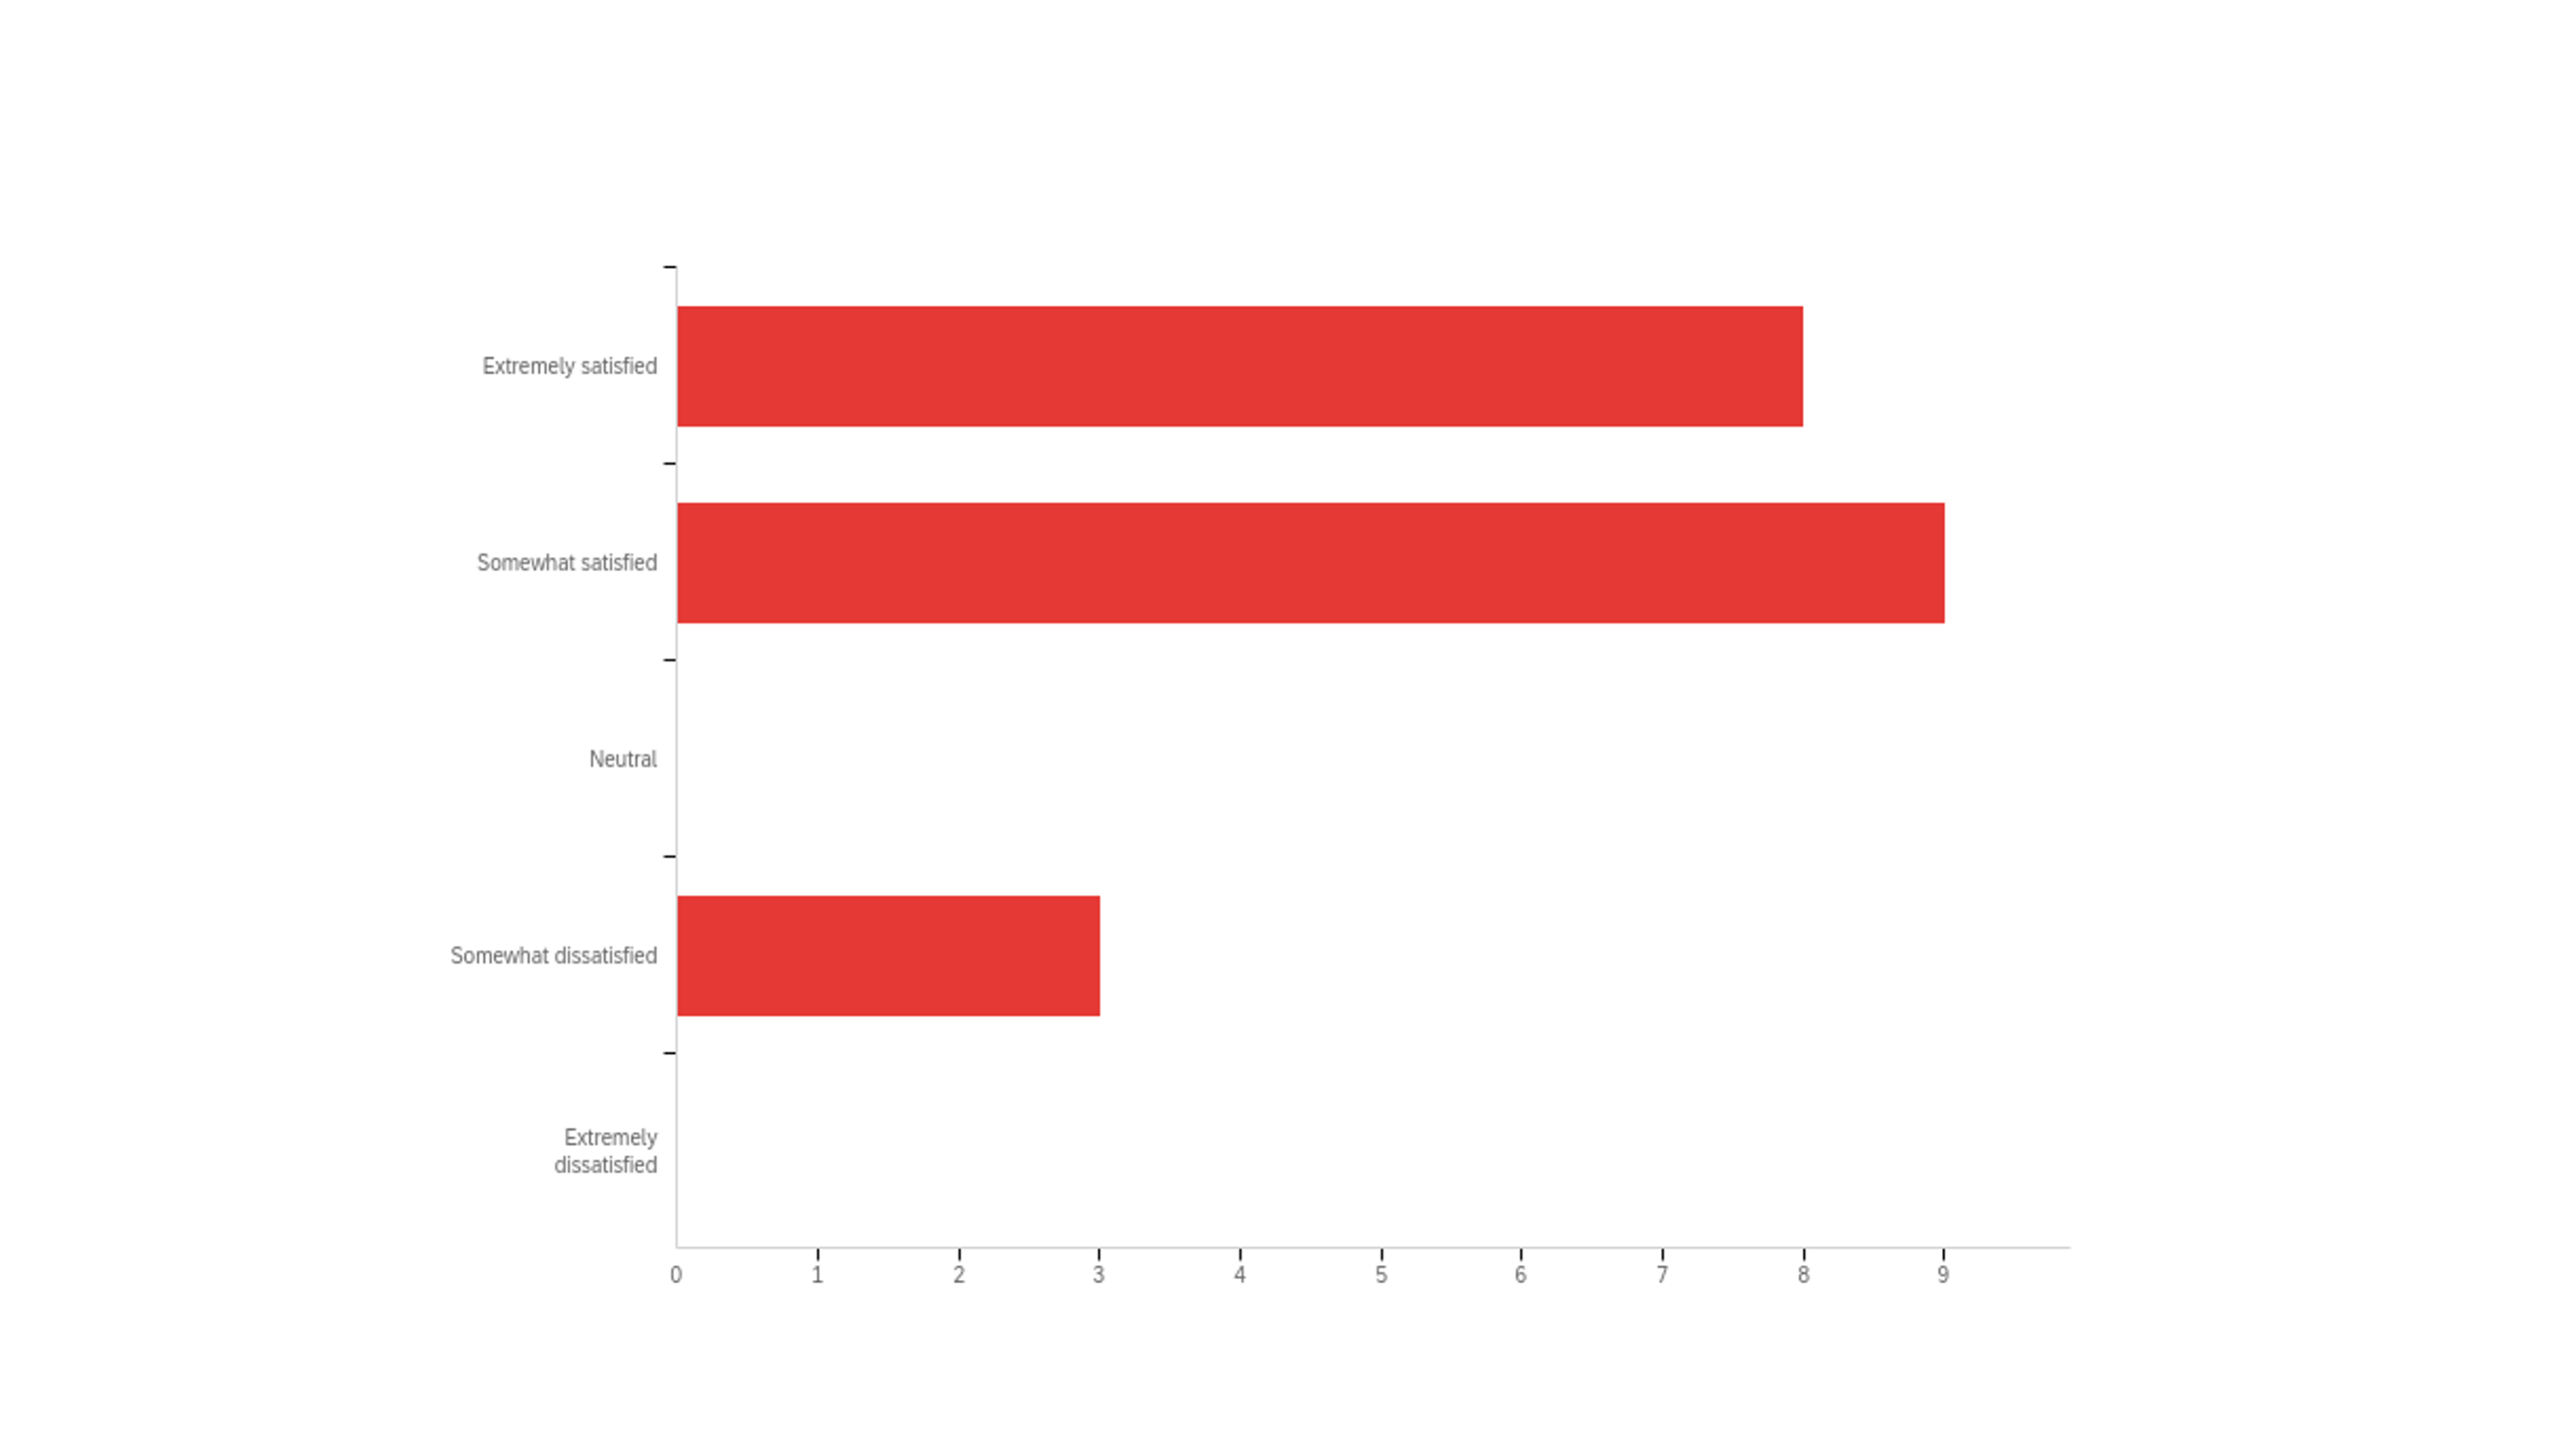
Fig. 4 - Biology graduate student responses to the query: How satisfied are you that your graduate program helped you learn and understand the fundamental concepts of your discipline?

Fig. 5 - Biology graduate student responses to the query: How satisfied are you that your graduate program improved your presentation skills?
updated November 2024