Overall Departmental Data
Information on enrollment, graduates, and student demographics.
Enrollment
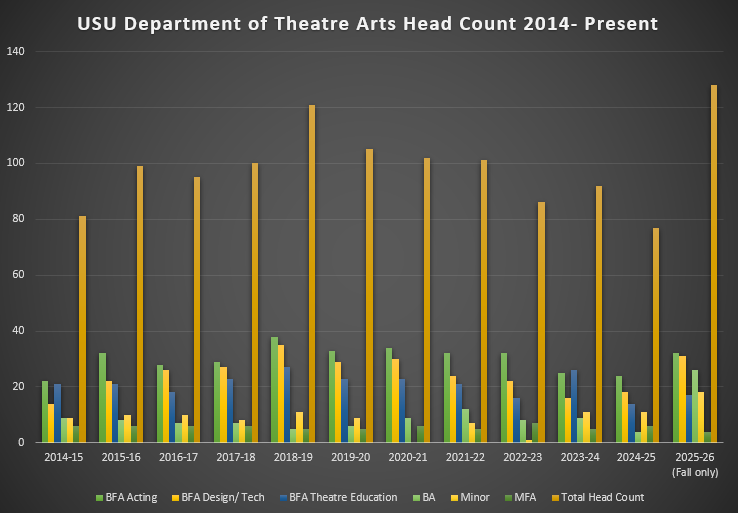
Department of Theatre Arts Head Counts 2014-Present
Enrollment Data (headcount) is taken from USU Registered Students lists in Fall Semester of each year.
| Dates | BFA Acting | BFA Design/ Tech |
BFA Theatre Ed | BA | Minor | MFA | Total Head Count |
|---|---|---|---|---|---|---|---|
| 2014-15 | 22 | 14 | 21 | 9 | 9 | 6 | 81 |
| 2015-16 | 32 | 22 | 21 | 8 | 10 | 6 | 99 |
| 2016-17 | 28 | 26 | 18 | 7 | 10 | 6 | 95 |
| 2017-18 | 29 | 27 | 23 | 7 | 8 | 6 | 100 |
| 2018-19 | 38 | 35 | 27 | 5 | 11 | 5 | 121 |
| 2019-20 | 33 | 29 | 23 | 6 | 9 | 5 | 105 |
| 2020-21 | 34 | 30 | 23 | 9 | 0 | 6 | 102 |
| 2021-22 | 32 | 24 | 21 | 12 | 7 | 5 | 101 |
| 2022-23 | 32 | 22 | 16 | 8 | 1 | 7 | 86 |
| 2023-24 | 25 | 16 | 26 | 9 | 11 | 5 | 92 |
| 2024-25 (Fall only) |
24 | 18 | 14 | 4 | 11 | 5 | 76 |
| 2025-26 (Fall only) |
32 | 31 | 17 | 26 | 18 | 4 | 128 |
Graduates
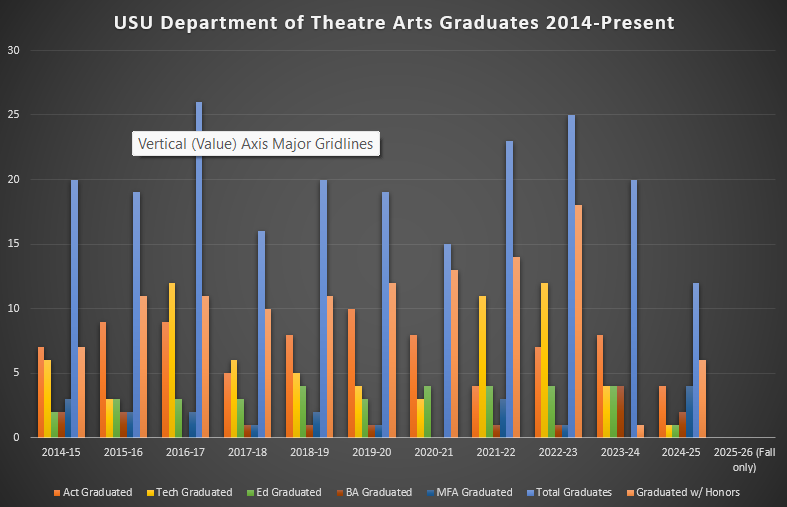
Department of Theatre Arts Graduates 2014-Present
Graduation Data is taken from Fall, Spring, & Summer Semester USU Graduation lists for each academic year.
| Dates | Act | Tech | Ed | BA | MFA | Total Graduates | Graduated w/ Honors |
|---|---|---|---|---|---|---|---|
| 2014-15 | 7 | 6 | 2 | 2 | 3 | 20 | 7 |
| 2015-16 | 9 | 3 | 3 | 2 | 2 | 19 | 11 |
| 2016-17 | 9 | 12 | 3 | 0 | 2 | 26 | 11 |
| 2017-18 | 5 | 6 | 3 | 1 | 1 | 16 | 10 |
| 2018-19 | 8 | 5 | 4 | 1 | 2 | 20 | 11 |
| 2019-20 | 10 | 4 | 3 | 1 | 1 | 19 | 12 |
| 2020-21 | 8 | 3 | 4 | 0 | 0 | 15 | 13 |
| 2021-22 | 4 | 11 | 4 | 1 | 3 | 23 | 14 |
| 2022-23 | 7 | 12 | 4 | 1 | 1 | 25 | 18 |
| 2023-24 | 8 | 4 | 4 | 4 | 0 | 20 | 1 |
| 2024-25 (Fall only) |
0 | 0 | 2 | 1 | 1 | 4 | 0 |
| 2025-26 (Fall only) |
0 |
Student Demographics
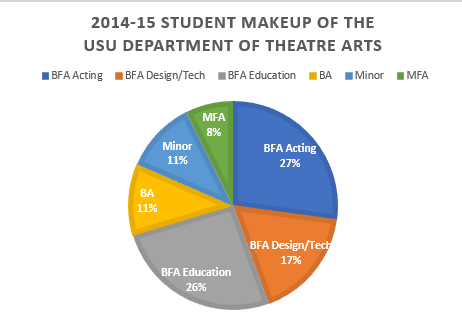
2014-2015 Student Demographic USU Department of Theatre Arts
| Area | # Students | % of Dept. |
|---|---|---|
| BFA Acting | 22 | 27% |
| BFA Design/Tech | 14 | 17% |
| BFA Education | 21 | 26% |
| BA | 9 | 8% |
| Minor | 9 | 11% |
| MFA | 6 | 8% |
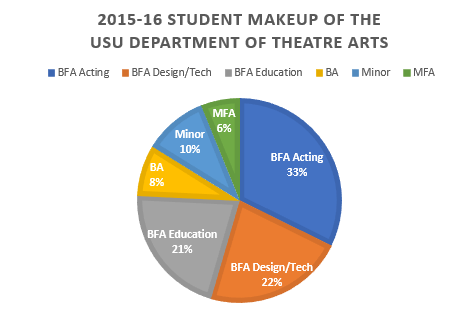
2015-2016 Student Demographic USU Department of Theatre Arts
| Area | # Students | % of Dept. |
|---|---|---|
| BFA Acting | 32 | 33% |
| BFA Design/Tech | 22 | 22% |
| BFA Education | 21 | 21% |
| BA | 8 | 8% |
| Minor | 10 | 10% |
| MFA | 6 | 6% |
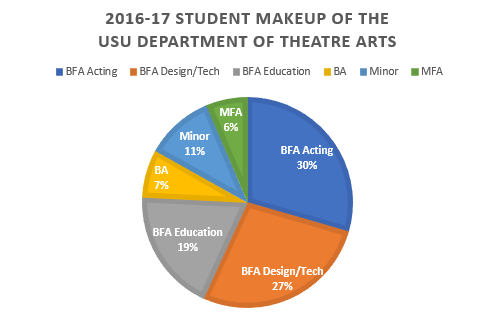
2016-2017 Student Demographic USU Department of Theatre Arts
| Area | # Students | % of Dept. |
|---|---|---|
| BFA Acting | 28 | 30% |
| BFA Design/Tech | 26 | 27% |
| BFA Education | 18 | 19% |
| BA | 7 | 7% |
| Minor | 10 | 11% |
| MFA | 6 | 6% |
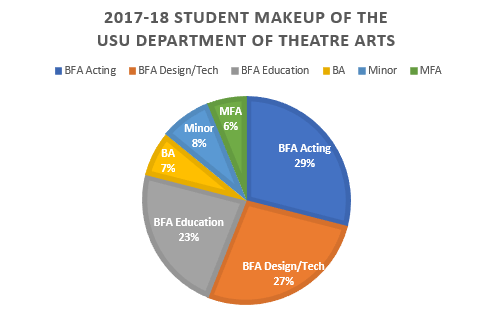
2017-2018 Student Demographic USU Department of Theatre Arts
| Area | # Students | % of Dept. |
|---|---|---|
| BFA Acting | 29 | 29% |
| BFA Design/Tech | 27 | 27% |
| BFA Education | 23 | 23% |
| BA | 7 | 7% |
| Minor | 8 | 8% |
| MFA | 6 | 6% |
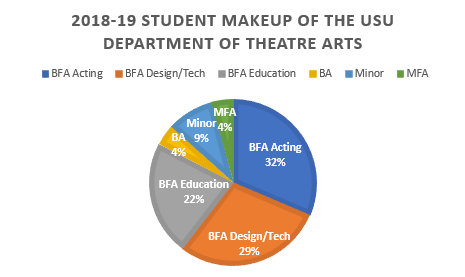
2018-2019 Student Demographic USU Department of Theatre Arts
| Area | # Students | % of Dept. |
|---|---|---|
| BFA Acting | 38 | 29% |
| BFA Design/Tech | 35 | 27% |
| BFA Education | 27 | 23% |
| BA | 5 | 7% |
| Minor | 11 | 8% |
| MFA | 5 | 6% |
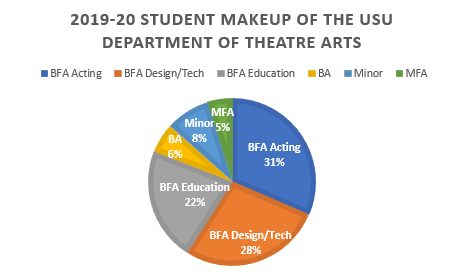
2019-2020 Student Demographic USU Department of Theatre Arts
| Area | # Students | % of Dept. |
|---|---|---|
| BFA Acting | 33 | 29% |
| BFA Design/Tech | 29 | 27% |
| BFA Education | 23 | 23% |
| BA | 6 | 7% |
| Minor | 9 | 8% |
| MFA | 5 | 6% |
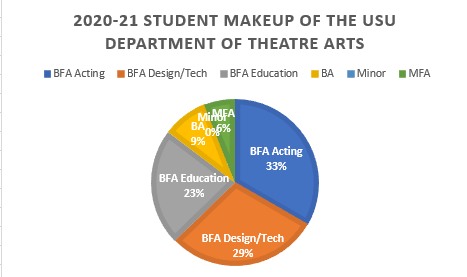
2020-2021 Student Demographic USU Department of Theatre Arts
| Area | # Students | % of Dept. |
|---|---|---|
| BFA Acting | 34 | 33% |
| BFA Design/Tech | 30 | 29% |
| BFA Education | 23 | 23% |
| BA | 9 | 9% |
| Minor | 0 | 0% |
| MFA | 6 | 6% |
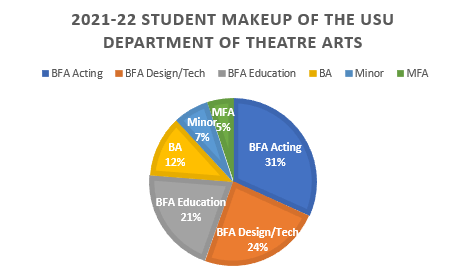
2021-2022 Student Demographic USU Department of Theatre Arts
| Area | # Students | % of Dept. |
|---|---|---|
| BFA Acting | 32 | 31% |
| BFA Design/Tech | 24 | 24% |
| BFA Education | 21 | 21% |
| BA | 12 | 12% |
| Minor | 7 | 7% |
| MFA | 5 | 5% |
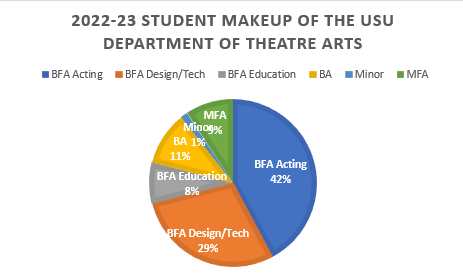
2022-2023 Student Demographic USU Department of Theatre Arts
| Area | # Students | % of Dept. |
|---|---|---|
| BFA Acting | 32 | 42% |
| BFA Design/Tech | 22 | 29% |
| BFA Education | 6 | 8% |
| BA | 8 | 11% |
| Minor | 1 | 1% |
| MFA | 7 | 9% |
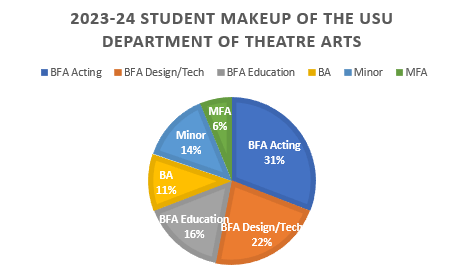
2023-2024 Student Demographic USU Department of Theatre Arts
| Area | # Students | % of Dept. |
|---|---|---|
| BFA Acting | 25 | 31% |
| BFA Design/Tech | 18 | 22% |
| BFA Education | 13 | 16% |
| BA | 9 | 11% |
| Minor | 11 | 14% |
| MFA | 5 | 6% |
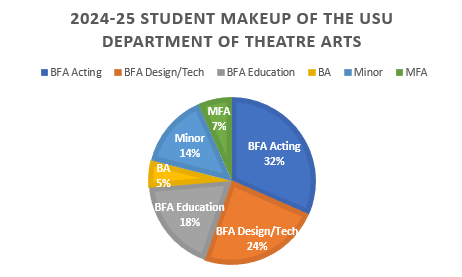
2024-2025 Student Demographic USU Department of Theatre Arts
| Area | # Students | % of Dept. |
|---|---|---|
| BFA Acting | 24 | 32% |
| BFA Design/Tech | 18 | 24% |
| BFA Education | 14 | 18% |
| BA | 4 | 5% |
| Minor | 11 | 14% |
| MFA | 5 | 7% |
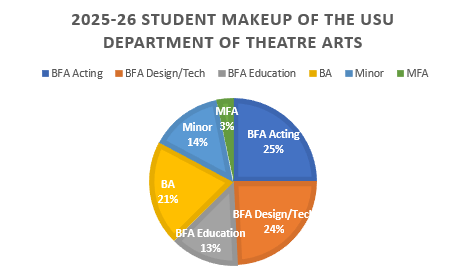
2025-2026 Student Demographic USU Department of Theatre Arts
| Area | # Students | % of Dept. |
|---|---|---|
| BFA Acting | 32 | 25% |
| BFA Design/Tech | 31 | 24% |
| BFA Education | 17 | 13% |
| BA | 26 | 21% |
| Minor | 18 | 14% |
| MFA | 4 | 3% |
Faculty Demographics
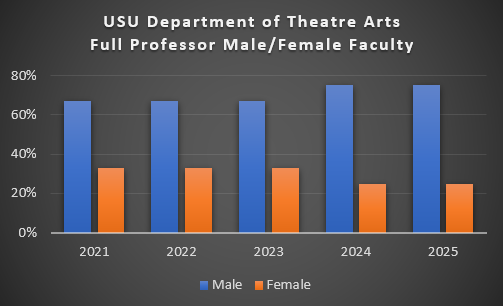
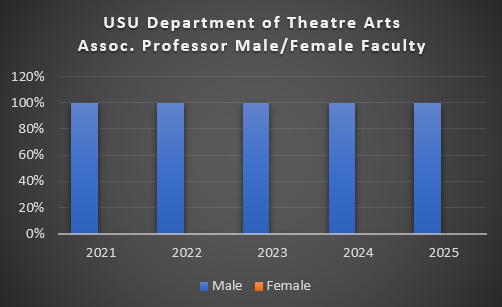
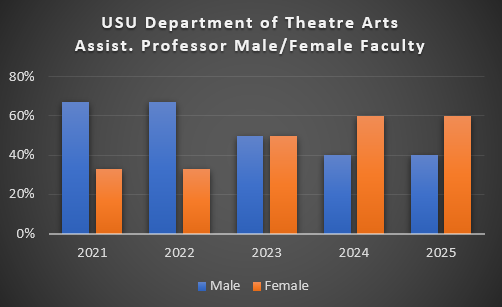
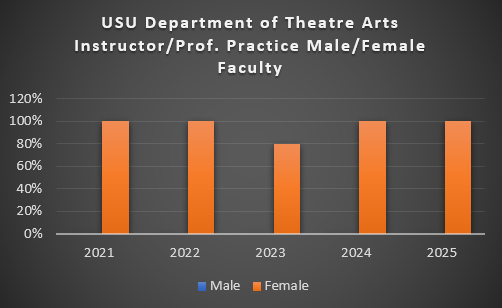
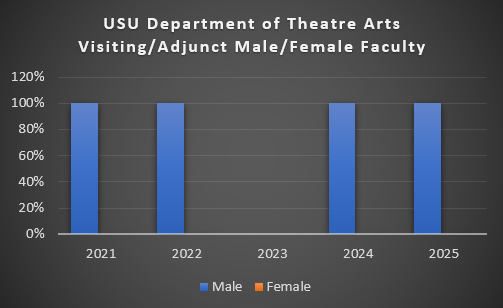
Male to Female Faculty Ratio 2021-Present
| 2021 | 2022 | 2023 | 2024 | 2025 | ||
|---|---|---|---|---|---|---|
| Full Professor | ||||||
| Male | 67% | 67% | 67% | 75% | 75% | |
| Female | 33% | 33% | 33% | 25% | 25% | |
| Assoc. Professor | ||||||
| Male | 100% | 100% | 100% | 100% | 100% | |
| Female | 0% | 0% | 0% | 0% | 0% | |
| Assist. Professor | ||||||
| Male | 67% | 67% | 50% | 40% | 40% | |
| Female | 33% | 33% | 50% | 60% | 60% | |
| Instructor/Prof. Practice | ||||||
| Male | 0% | 0% | 20% | 0% | 0% | |
| Female | 100% | 100% | 80% | 100% | 100% | |
| Visiting/Adjunct | ||||||
| Male | 100% | 100% | 100% | 100% | ||
| Female | 0% | 0% | 0% | 0% |
Male to Female Faculty Rank & Education
2021-22
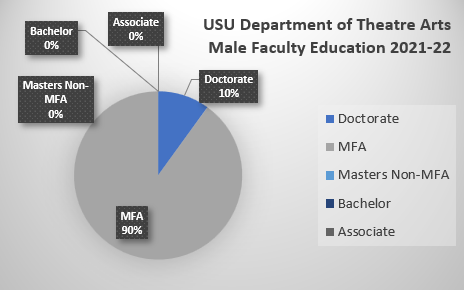
Male Faculty Rank/Education 2021-2022
Data taken from annual NAST HEADS survey
| # | Doctorate | MFA | Masters Non-MFA | Bachelor | Associate | Total |
|---|---|---|---|---|---|---|
| Full Professor | 1 | 3 | 0 | 0 | 0 | 4 |
| Assoc. Professor | 4 | 0 | 0 | 0 | 4 | |
| Assist. Professor | 1 | 0 | 0 | 0 | 1 | |
| Instructor/Prof. Practice | 0 | 0 | 0 | 0 | ||
| Visiting/Adjunct | 1 | 0 | 0 | 0 | 1 | |
| Total | 1 | 9 | 0 | 0 | 0 | 10 |
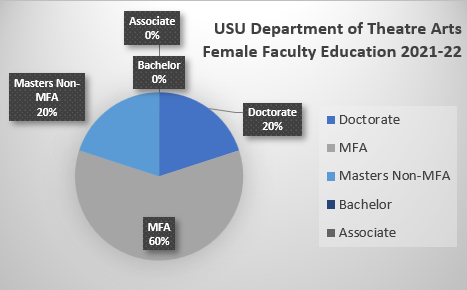
Female Faculty Rank/Education 2021-2022
Data taken from annual NAST HEADS survey
| # | Doctorate | MFA | Masters Non-MFA | Bachelor | Associate | Total |
|---|---|---|---|---|---|---|
| Full Professor | 0 | 2 | 0 | 0 | 0 | 2 |
| Assoc. Professor | 0 | 0 | 0 | 0 | 0 | 0 |
| Assist. Professor | 1 | 1 | 0 | 0 | 0 | 2 |
| Instructor/Prof. Practice | 1 | 0 | 0 | 1 | ||
| Visiting/Adjunct | 0 | 0 | 0 | 0 | 0 | |
| Total | 1 | 3 | 1 | 0 | 0 | 5 |
2022-23
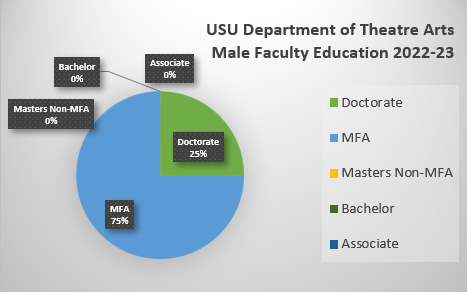
Male Faculty Rank/Education 2022-2023
Data taken from annual NAST HEADS survey
| # | Doctorate | MFA | Masters Non-MFA | Bachelor | Associate | Total |
|---|---|---|---|---|---|---|
| Full Professor | 1 | 3 | 0 | 0 | 0 | 4 |
| Assoc. Professor | 4 | 0 | 0 | 0 | 4 | |
| Assist. Professor | 1 | 0 | 0 | 0 | 1 | |
| Instructor/Prof. Practice | 0 | 0 | 0 | 0 | ||
| Visiting/Adjunct | 1 | 0 | 0 | 0 | 1 | |
| Total | 1 | 9 | 0 | 0 | 0 | 10 |
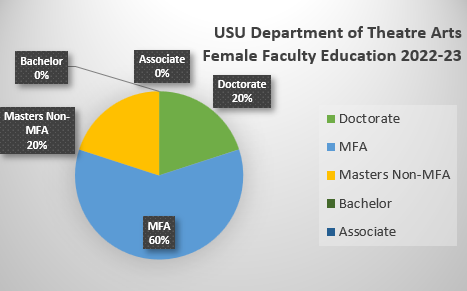
Female Faculty Rank/Education 2022-2023
Data taken from annual NAST HEADS survey
| # | Doctorate | MFA | Masters Non-MFA | Bachelor | Associate | Total |
|---|---|---|---|---|---|---|
| Full Professor | 0 | 2 | 0 | 0 | 0 | 2 |
| Assoc. Professor | 0 | 0 | 0 | 0 | 0 | 0 |
| Assist. Professor | 1 | 1 | 0 | 0 | 0 | 2 |
| Instructor/Prof. Practice | 1 | 0 | 0 | 1 | ||
| Visiting/Adjunct | 0 | 0 | 0 | 0 | 0 | |
| Total | 1 | 3 | 1 | 0 | 0 | 5 |
2023-24
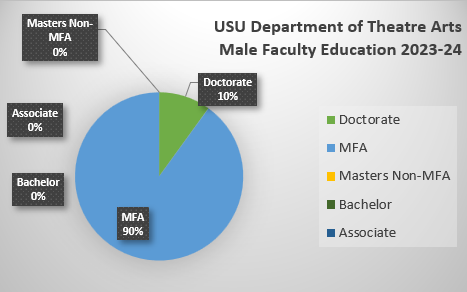
Male Faculty Rank/Education 2023-2024
Data taken from annual NAST HEADS survey
| # | Doctorate | MFA | Masters Non-MFA | Bachelor | Associate | Total |
|---|---|---|---|---|---|---|
| Full Professor | 0 | 4 | 0 | 0 | 0 | 4 |
| Assoc. Professor | 1 | 2 | 0 | 0 | 0 | 3 |
| Assist. Professor | 2 | 0 | 0 | 0 | 2 | |
| Instructor/Prof. Practice | 1 | 0 | 0 | 0 | 1 | |
| Visiting/Adjunct | 0 | 0 | 0 | 0 | 0 | |
| Total | 1 | 9 | 0 | 0 | 0 | 10 |
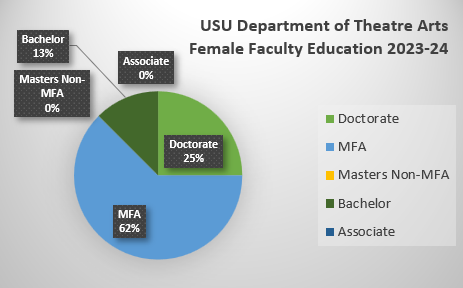
Female Faculty Rank/Education 2023-2024
Data taken from annual NAST HEADS survey
| # | Doctorate | MFA | Masters Non-MFA | Bachelor | Associate | Total |
|---|---|---|---|---|---|---|
| Full Professor | 0 | 2 | 0 | 0 | 0 | 2 |
| Assoc. Professor | 0 | 0 | 0 | 0 | 0 | 0 |
| Assist. Professor | 2 | 0 | 0 | 0 | 0 | 2 |
| Instructor/Prof. Practice | 3 | 0 | 1 | 0 | 4 | |
| Visiting/Adjunct | 0 | 0 | 0 | 0 | 0 | |
| Total | 2 | 5 | 0 | 1 | 0 | 8 |
2024-25
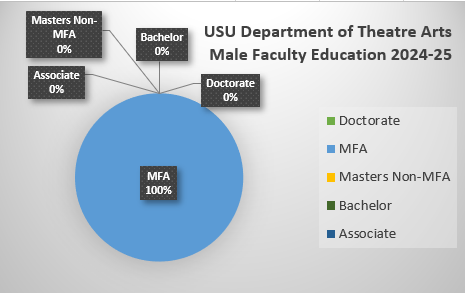
Male Faculty Rank/Education 2024-2025
Data taken from annual NAST HEADS survey
| # | Doctorate | MFA | Masters Non-MFA | Bachelor | Associate | Total |
|---|---|---|---|---|---|---|
| Full Professor | 0 | 3 | 0 | 0 | 0 | 3 |
| Assoc. Professor | 3 | 0 | 0 | 0 | 3 | |
| Assist. Professor | 2 | 0 | 0 | 0 | 2 | |
| Instructor/Prof. Practice | 0 | 0 | 0 | 0 | 0 | |
| Visiting/Adjunct | 1 | 0 | 0 | 0 | 1 | |
| Total | 0 | 9 | 0 | 0 | 0 | 9 |
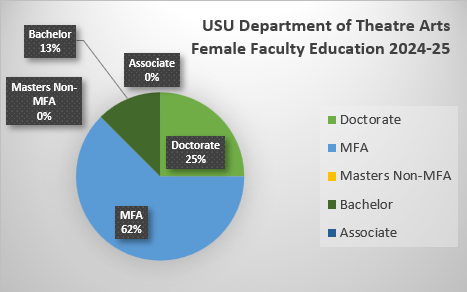
Female Faculty Rank/Education 2024-2025
Data taken from annual NAST HEADS survey
| # | Doctorate | MFA | Masters Non-MFA | Bachelor | Associate | Total |
|---|---|---|---|---|---|---|
| Full Professor | 0 | 1 | 0 | 0 | 0 | 1 |
| Assoc. Professor | 0 | 0 | 0 | 0 | 0 | |
| Assist. Professor | 2 | 1 | 0 | 0 | 0 | 3 |
| Instructor/Prof. Practice | 3 | 0 | 1 | 0 | 4 | |
| Visiting/Adjunct | 0 | 0 | 0 | 0 | 0 | |
| Total | 2 | 5 | 0 | 0 | 0 | 8 |
2025-26
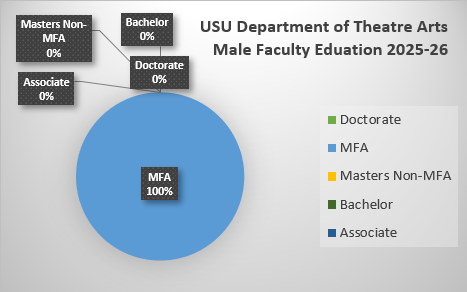
Male Faculty Rank/Education 2025-2026
Data taken from annual NAST HEADS survey
| # | Doctorate | MFA | Masters Non-MFA | Bachelor | Associate | Total |
|---|---|---|---|---|---|---|
| Full Professor | 0 | 3 | 0 | 0 | 0 | 3 |
| Assoc. Professor | 0 | 2 | 0 | 0 | 0 | 2 |
| Assist. Professor | 0 | 2 | 0 | 0 | 0 | 2 |
| Instructor/Prof. Practice | 0 | 0 | 0 | 0 | 0 | 0 |
| Visiting/Adjunct | 0 | 1 | 0 | 0 | 0 | 1 |
| Total | 0 | 8 | 0 | 0 | 0 | 8 |
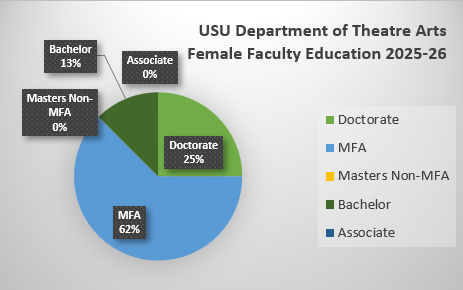
Female Faculty Rank/Education 2025-2026
Data taken from annual NAST HEADS survey
| # | Doctorate | MFA | Masters Non-MFA | Bachelor | Associate | Total |
|---|---|---|---|---|---|---|
| Full Professor | 0 | 1 | 0 | 0 | 0 | 1 |
| Assoc. Professor | 0 | 0 | 0 | 0 | 0 | |
| Assist. Professor | 2 | 1 | 0 | 0 | 0 | 3 |
| Instructor/Prof. Practice | 3 | 0 | 1 | 0 | 4 | |
| Visiting/Adjunct | 0 | 0 | 0 | 0 | 0 | |
| Total | 2 | 5 | 0 | 1 | 0 | 8 |